
13B at different pressures - compressor map

13B at different pressures - compressor map
This is for reference only. I was getting frustrated recalculating compressor map points while im on a hunt for a single turbo.
I made this graph to show a 13bs air flow output in LB/MIN at 2000-8500 RPM at various pressure ratios. OBVIOUSLY, this is for quick reference only. I used the 2.6*90*RPM*PR/5660 then divided by 14.27 to get CFM to LB/min. This doesnt factor temperature, porting etc
Its something that lines up on a compressor map and helps evaluate the air flow at different points. I understand that 2000rpm at 23PSI boost is unbelievably unlikely,but its for example. :-)
If it is wrong, please point it out and ill update it. That only helps me :-D
Rob
Rotorhead
Joined: Feb 2001
Posts: 9,136
Likes: 39
From: Charlottesville, Virginia, USA
That should work as a SWAG. Just keep in mind that there is usually about 1.5-2.0psi drop between the compressor and the intake manifold at max boost, so in order to achieve a given manifold boost pressure you will need to run the turbo at a slightly higher pressure ratio to compensate for the loss. Other than that and the engine porting & redline differences, I don't think the various other factors are of much consequence as long as you give yourself a little bit of leeway when choosing the turbo.


This is for reference only. I was getting frustrated recalculating compressor map points while im on a hunt for a single turbo.
I made this graph to show a 13bs air flow output in LB/MIN at 2000-8500 RPM at various pressure ratios. OBVIOUSLY, this is for quick reference only. I used the 2.6*90*RPM*PR/5660 then divided by 14.27 to get CFM to LB/min. This doesnt factor temperature, porting etc
Its something that lines up on a compressor map and helps evaluate the air flow at different points. I understand that 2000rpm at 23PSI boost is unbelievably unlikely,but its for example. :-)
If it is wrong, please point it out and ill update it. That only helps me :-D
Rob
I made this graph to show a 13bs air flow output in LB/MIN at 2000-8500 RPM at various pressure ratios. OBVIOUSLY, this is for quick reference only. I used the 2.6*90*RPM*PR/5660 then divided by 14.27 to get CFM to LB/min. This doesnt factor temperature, porting etc
Its something that lines up on a compressor map and helps evaluate the air flow at different points. I understand that 2000rpm at 23PSI boost is unbelievably unlikely,but its for example. :-)
If it is wrong, please point it out and ill update it. That only helps me :-D
Rob
Very helpfull. Are you able to expand this to 30psi?
Pressure Ratios
PSI P/r
7 1.4
10 1.6
12 1.8
1B 2.0
15 2.02
17 2.15
18 2.22
20 2.36
22 2.49
25 2.70
27 2.83
30 3.04
32 3.17
35 3.38
40 3.72
8500rpm redline(VE90) below
15lbs 49.25=702cfm
18lbs 54.17=773cfm
20lbs 58.11=829cfm
25lbs 66.4=947cfm
27lbs 69.6=994cfm
30lbs 74.8=1068cfm
32lbs 78.0=1113cfm
35lbs 83.2=1187cfm
40lbs 91.6=1307cfm
You can use that, if rdahm wants to graph all that I will update it in the thread up top as I have a big post on reading turbine maps I need to get up there as well some day, I just never get around to proofing it.
These numbers are round about figures for estimation purposes only, evil is right in figuring a drop across the core. A good rule of thumb on a efficient core is 1psi drop for every 10psi of boost. So at 10psi your drop is 1psi, and at 30psi your drop is 3psi.
2psi is a good safe bet for most street driven mid framed turbo FD's.
Trending Topics

Banned. I got OWNED!!!
Joined: Jan 2010
Posts: 2
Likes: 0
From: East Coast
this is all relative you could be below sea level and it could differ greatly.
sorry i didnt see the post above me about the altitude.
sorry i didnt see the post above me about the altitude.
Last edited by mar3; Apr 17, 2010 at 01:46 AM. Reason: Merged back-to-back posts...
Here is an example of a GT35r map. i overlaid the 13b rough air flows. keep in mind the dots start at 2000RPM and end at 8500RPM.
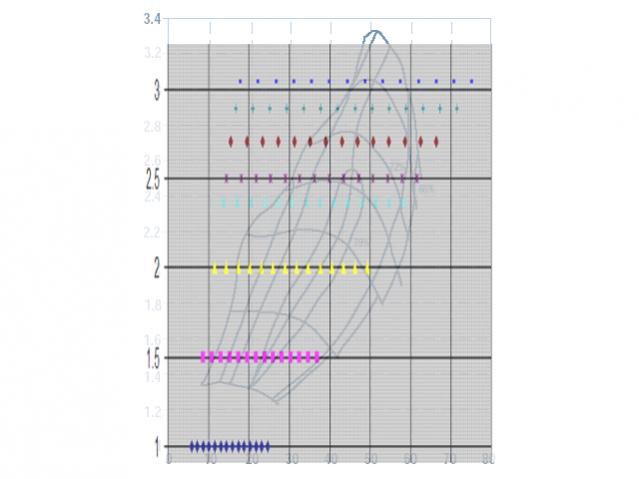
so at 2.5 Compressor Ratio (22 PSI minus the inlet loss) the surge line is right after the 4000 RPM mark. That suggests that the compressor would begin generating 22PSI at ~4200 RPM. Use your judgement, these are just rough numbers. There are many factors that alter the performance.
So at the peak it is suggesting that 30 PSI (lol) could be generated at 5200rpm-6500 rpm.
There is obviously a minimum and a maximum where this rough formula is correct. Just like newtonian physics, it is efficient within a certain range.
i have a formula on calculating the effect inlet temp has on outlet temp of the turbo based on compression etc. but how that figures into air flow, would be another deal. Air density and all.

Junior Member
Joined: Feb 2010
Posts: 13
Likes: 0
From: Germany
what about those pages here:
http://www.squirrelpf.com/turbocalc/index.php
http://www.not2fast.com/turbo/glossa..._calc.shtml#sz
http://www.squirrelpf.com/turbocalc/index.php
http://www.not2fast.com/turbo/glossa..._calc.shtml#sz
nice websites! they have a million configurations too. I just tried one specific to rotaries and they approximated the same numbers. thats reassuring.
i guess you could print my graph out and connect the dots lol.
i guess you could print my graph out and connect the dots lol.
Junior Member
Joined: Feb 2010
Posts: 13
Likes: 0
From: Germany
I remember doing the transparent excel graphs and overlaying compressor maps too but then I found those web sites. Both sides have their specific advantages. For sizing turbos I quite like the first link. A bit more deltail becomes availab le under link 2.
I tweak the volumetric efficiency numbers by starting from known set points. Inputs would be stock power and rpm at which this is obtained. I adapt IC pressure drop to a sensible number and that change vol Eff till the boost level meets the stock spec. A second point can be had by using the torque max of the stock engine and proceeding in a similar way. So far I could verify my findings with three real life projects I have done and they all match very well.
I tweak the volumetric efficiency numbers by starting from known set points. Inputs would be stock power and rpm at which this is obtained. I adapt IC pressure drop to a sensible number and that change vol Eff till the boost level meets the stock spec. A second point can be had by using the torque max of the stock engine and proceeding in a similar way. So far I could verify my findings with three real life projects I have done and they all match very well.

Thread
Thread Starter
Forum
Replies
Last Post
trickster
2nd Generation Specific (1986-1992)
25
Jul 1, 2023 04:40 PM