When you click on links to various merchants on this site and make a purchase, this can result in this site earning a commission. Affiliate programs and affiliations include, but are not limited to, the eBay Partner Network.
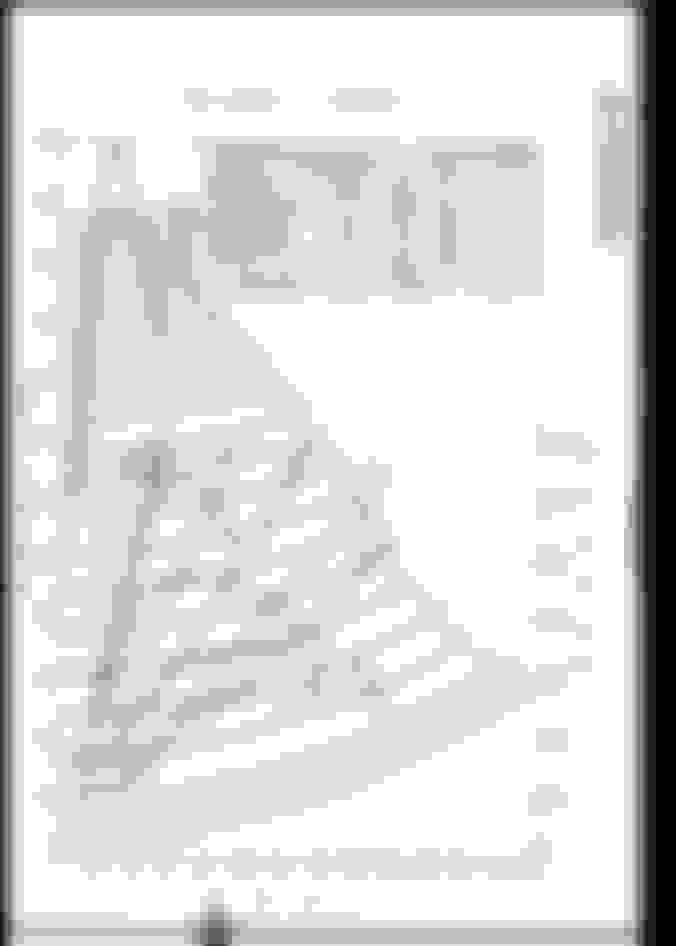
Blue TII has posted some graphs of which we can't find, of torque to the wheels. in my travels i ran across the factory S5 T2 graph of torque to the wheels.
yeah, the percentages are still a mystery to me, and i also don't know how to get the kg turned into the standard kg.m unit. if only i could read Japanese ... i'm guessing those numbers in the column with the weight (0.014, 0.0022 and 1.83) are probably part of some sort of conversion factor.
I like charts like this because it shows in graphic (heh) detail that for best acceleration you need to run WAY past peak horsepower.
Looking at the chart, even if you shift 2-3 and ESPECIALLY 1-2 at redline, you are losing acceleration compared to if you ran the gear out longer.
I was researching DSG-equipped Golf Rs (because I don't have enough cars) and I found a tuner site that made me basically swear off all information they had as being spurious.... the guy claimed that it was pointless to rev an engine past peak horsepower so he retuned the shift maps to compensate. That is wrong, what you want is for horsepower before the shift to equal horsepower after the shift, which depending on curve shape and gear spread means you may need to rev 2000rpm past peak power.
If you accept that "torque at the wheels by speed" is simply "driveshaft horsepower", you'd want to shift when the curves overlap. That is when the power is equal from one gear to the next. (We're incorporating speed in the graph, so what we are looking at is power, really)
it is two graphs in one, its rpm vs speed vs gear and torque vs speed.
i'm not sure what the percentages are, maybe throttle position?
I'm asssuming transfer efficiency. Note that it is 90% in the gears that go through the countershaft and 92% for 4th gear. This meshes well with the fact that hypoid gears are lossy due to the inherent sliding friction in the gear mesh - the rearend is accountable for 8% driveline losses and the transmission 2%. Or looked at another way, the rearend sucks four times as much power as the trans.
It's also interesting that one of the figures on the chart has a tire size. Tire losses?
Audi had a similar paper in the early 80s (that I have not read) where they showed that, due to tires' nonlinear loss rate relative to power input, an all wheel drive car became more efficient than two wheel drive at higher power levels. These power levels corresponded to about 100mph cruise speed, but then again this was also Germany in the early 80s. Makes me wonder if dually pickups get better fuel economy than single-tire trucks when under heavy towing loads.
edit: Or maybe I am reading it all wrong and that's Reverse gear. Which would account for the double curve on the top. And the 87% lossage, since Reverse adds another gear to load through relative to the forward gears. Leaving my tire ruminations in place because it's neat to think about.
It's also interesting that one of the figures on the chart has a tire size. Tire losses?
its possible. there are actually 4 different graphs in the book, coupe, vert and ???
as an aside, everyone computes the shock forces by chucking the shock on the shock tester, but i think Mazda uses the whole shock, mounts and all the gubbins. in a perfect world it wouldn't matter, but its not is it?
Peak torque is max acceleration in a given gear, peak power is max acceleration at a given speed. The engine makes less torque but the increased gear reduction more than makes up for it. (That's all horsepower is, really - it's a nice shorthand figure for comparing torque vs. gear reduction)
You pretty much never want to be near peak torque if you are trying to accelerate as hard as you can, except as you pass through it in First gear.
edit: Or maybe I am reading it all wrong and that's Reverse gear. Which would account for the double curve on the top. And the 87% lossage, since Reverse adds another gear to load through relative to the forward gears. Leaving my tire ruminations in place because it's neat to think about.
that was my interpretation. if you look at the listing of the ratios, that same character/kanji(?) (where i assume they listed the reverse ratio) is on the lines closest to the first gear curves.