
AFR for Fd?


One thing I question though: those are "target" values, not actual measured values. It would make a lot more sense if someone had wideband data from a stock car to draw the conclusion that X car runs richer than a stock FD. Just saying...

power and torque graph:
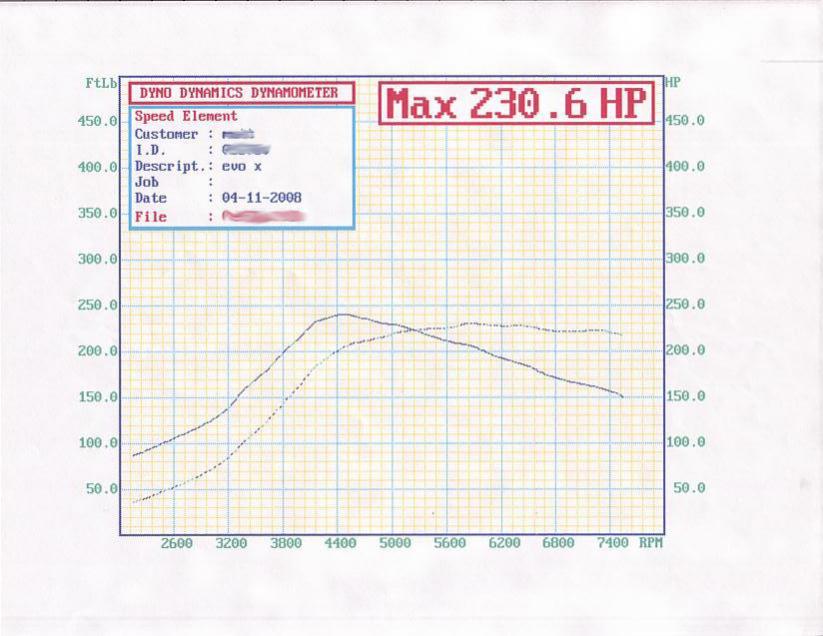
Probably in real world testing, the FD and most other turbo cars run in an AFR range that is not too far off--high 9's to low 10's. But that is contrary to the usual storyline around here that "Mazda tuned the rotary excessuvely rich from the factory, that's why we have x problem." Every car forum complains about that, especially cars with factory turbos. Go on Subaru forums, they bitch. Go on Mitsu forums, they bitch. Go on Nissan forums, they bitch. But it's all the same **** across manufacturers. You have to keep the NOx emissions down and preserve the cat.
Now for more maps. Here is the target AFR view for the default PFC basemap that I was referring to earlier. This is what the PFC was originally intended to achieve if installed on a completely stock Rx-7.

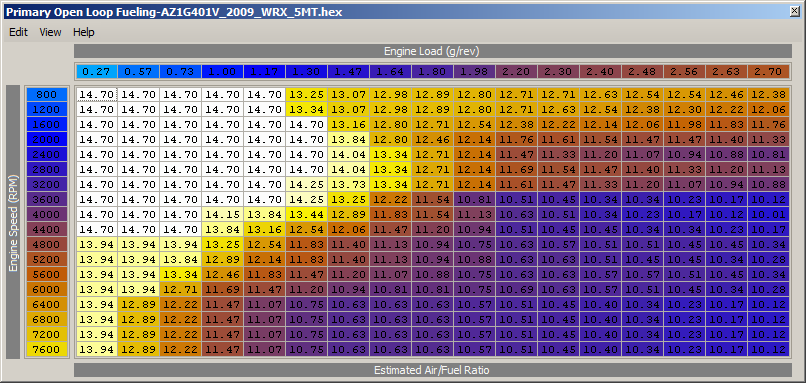
Here is the 09 WRX AFR map:
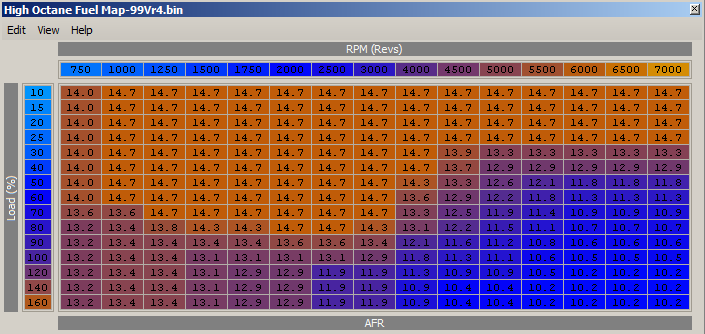
Here is a 1999 3000GT Vr4 twin turbo AFR map:
On a stock car these targets are very close to the measured AFR, because a factory PCM is filled with all sorts of proprietary data about the engine and then dynamically model it while driving. The fuel trim strategy (fuel learning) corrects the AFR's to stay in line as the weather changes. I have personally logged AFR on the turbo Subaru Legacy GT. The target AFR's were within .3 of the value in the target table (usually richer than the target). This was as long as the stock intake and intercooler remain. That's the key. When you change around the MAF housing or anything that straightens the flow into the sensor, it throws everything off. I have a paper from 1994 which explains some algorithms used by MAF sensors to calculate charge air. It also relates the speed density calculation to the mass air calculation. PM me if you are interested.
Anyway, the load index in those maps varies with the manufacturer. For the Subaru it is the simplest. The Subaru uses a hotwire mass air meter where the transfer function has voltage directly related to mass airflow. The basic load index is grams/sec *60 / rpm , with minor corrections. This is a similar method to the way the Power FC calculates load on L Jetro models (MAF equipped). The most recent GM's use a hot film mass airflow sensor which produces a square wave, where a greater frequency corresponds to more mass airflow and load indexes are grams/cylinder like the Subarus. The Mitsubishi's are more complicated because they use a Karman Vortex volume airflow sensor (doesn't directly measure mass) which produces a square wave/frequency for volume airflow. Their load calculation isn't 100% understood... there are certain logged values in the calculation that nobody has fully disassembled.
The Nissan load index is closer to what you would see in a modern diesel and is not intuitive. It is based on theoretical pulsewidth and has been from the Z31 300zx all the way up to the current R35 GTR. Theoretical pulsewidth is sort of like the values in the normal view of the basemap. It is the amount of fuel required to reach 14.7:1 or lambda = 1. It is directly related to airflow divided by rpm though. So you have target AFR vs rpm and the basic amount of fuel needed to reach lambda = 1. Higher theoretical pulsewidth corresponds to more airflow and more absolute load (see SAE J1979 for SAE standardized load calculations). This use of a fuel schedule is similar to the way a modern GM diesel creates their load index for injector timing and other tables.

Thread
Thread Starter
Forum
Replies
Last Post