
Turbo Compressor Map w/ 13B Flow Plots

Thread Starter
Joined: Sep 2006
Posts: 150
Likes: 1
From: Louisville, Kentucky
Turbo Compressor Map w/ 13B Flow Plots
I'm currently trying to decide on which turbo I want, so I've been doing a lot of reading. While looking around today I came across this website:
http://www.mygen.com/users/dbruce/my...sor%20Maps.htm
I hadn't ever seen this kind of plotting done for a 13B, so I decided to give it a shot.
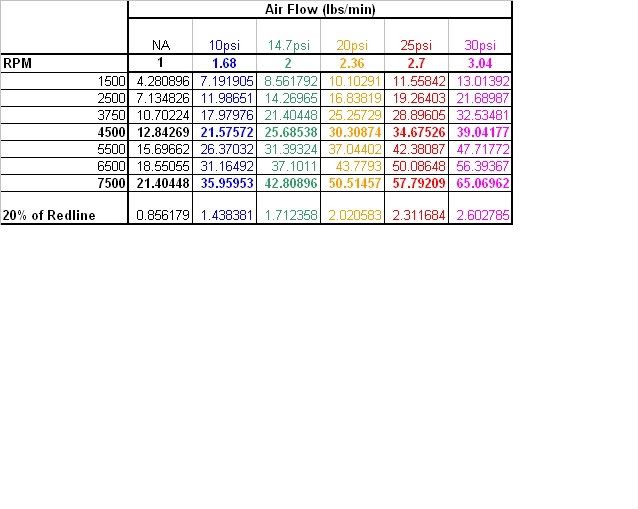
I used a 158.6 CI displacement and a 90% VE for a streetported motor (found in another thread, not sure on validity) and a conservative 7500 RPM redline.
I assumed the formula's he used in his calculations are accurate as I believe I had seen them elsewhere before. The only assumption I'm unsure of, is the difference between flow levels at each pressure ratio. The author on that website essentially took the naturally aspirated flow level, and multiplied by the pressure ratio. This means that the rise in air flow with pressure increase is linear. I don't have enough of a background to know whether this is the case, or whether it should be different. I haven't had a chance to do some researching either. Even if it increases exponentially or something of the like, it should be easy to make that change in the calculations I made.
Here they are:
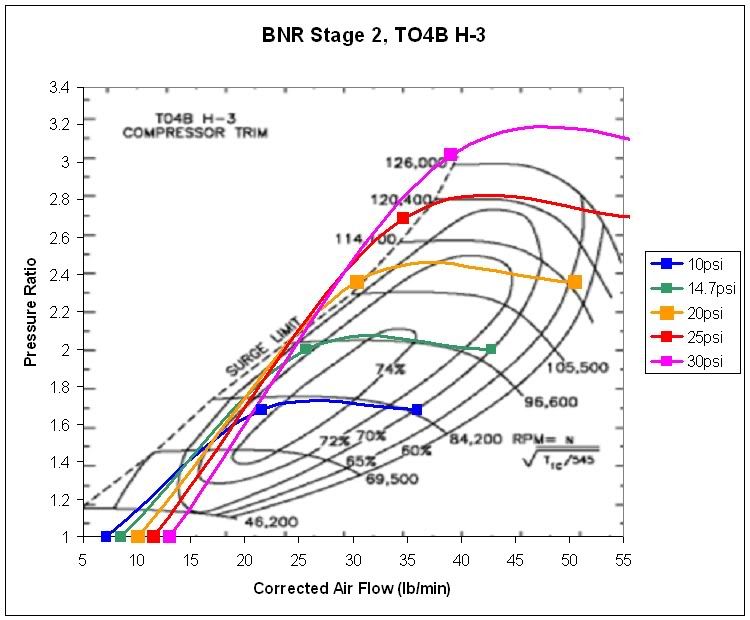
I thought the BNR plots were interesting. The 60-1 Wheel looks like a great match between 10 and maybe 22-23 PSI.
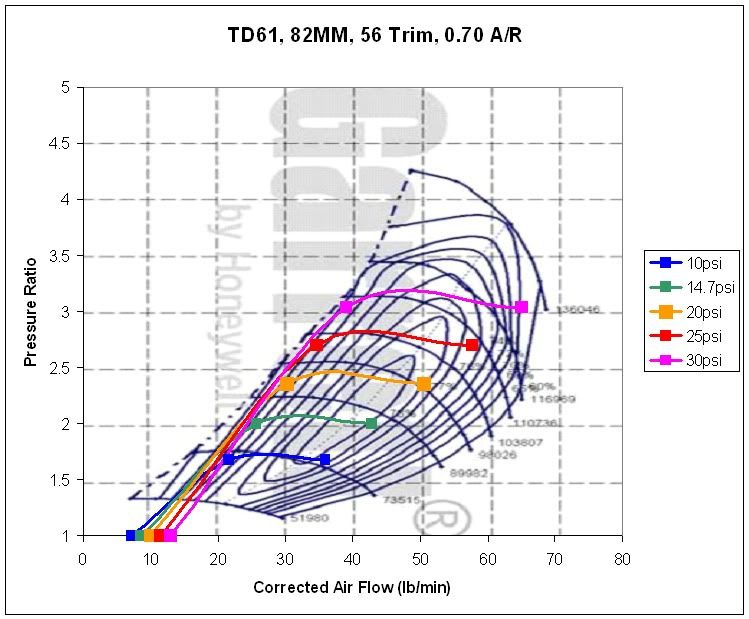
The TD61 seems like a great choice also. Pretty much all of the lines go right through the central efficiency range of the turbo.
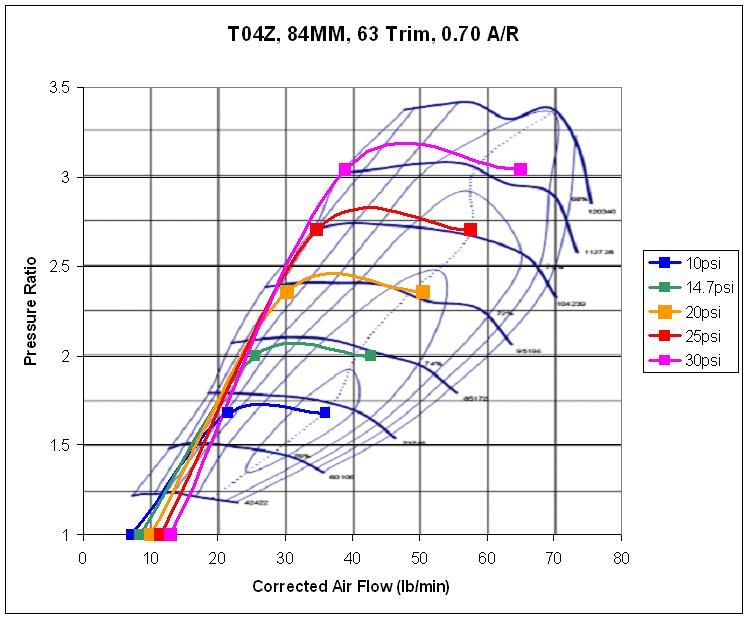
As you can see on the T04Z plot, besides the 30 PSI point, the other 7500 RPM points are VERY close to that dashed line in the middle of the compressor map, which is interesting as well.
Discuss.
PS- I can also send the spreadsheet to anyone who wants to play around with the numbers/plots.
http://www.mygen.com/users/dbruce/my...sor%20Maps.htm
I hadn't ever seen this kind of plotting done for a 13B, so I decided to give it a shot.
I used a 158.6 CI displacement and a 90% VE for a streetported motor (found in another thread, not sure on validity) and a conservative 7500 RPM redline.
I assumed the formula's he used in his calculations are accurate as I believe I had seen them elsewhere before. The only assumption I'm unsure of, is the difference between flow levels at each pressure ratio. The author on that website essentially took the naturally aspirated flow level, and multiplied by the pressure ratio. This means that the rise in air flow with pressure increase is linear. I don't have enough of a background to know whether this is the case, or whether it should be different. I haven't had a chance to do some researching either. Even if it increases exponentially or something of the like, it should be easy to make that change in the calculations I made.
Here they are:
I thought the BNR plots were interesting. The 60-1 Wheel looks like a great match between 10 and maybe 22-23 PSI.
The TD61 seems like a great choice also. Pretty much all of the lines go right through the central efficiency range of the turbo.
As you can see on the T04Z plot, besides the 30 PSI point, the other 7500 RPM points are VERY close to that dashed line in the middle of the compressor map, which is interesting as well.
Discuss.
PS- I can also send the spreadsheet to anyone who wants to play around with the numbers/plots.


The tricky thing is that VE is not really fixed. It varies with rpm, especially with different port timing and manifold designs. I don't have any specs on the turbo engines but here are plots from Mazda on several n/a engines:

Black is 6 port Renesis, grey is 4 port Renesis, pink is s5 6 port. All three of these engines have variable length intake runners (VDI system). The 4 port Renesis is very different from the old Rx-7 4 port engines. I imagine your typical street ported 4 port rotary has poor VE under about 3000-4000rpm, with enhanced VE at the top end. Using a fixed VE % doesn't make these calculations useless but it's certainly a limitation.
It's not a 13B, but here is a plot of a prototype single turbo 20B that Mazda made (couldn't find anything like this for a 13B). This single turbo has output equivalent to the 20B sequential twins. The only spec given is that this compressor wheel has a 72mm exducer.
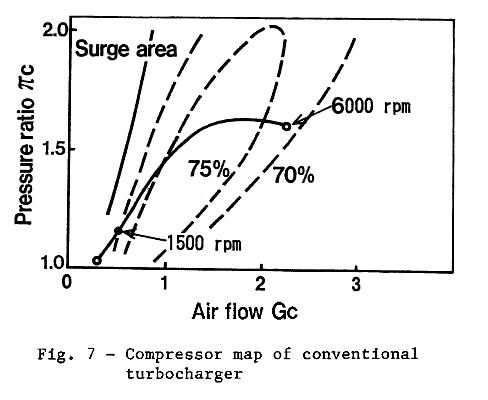
I believe the airflow units are in grams/sec * 100 , where each "1" on this chart would correspond to about 13.2 lb/min airflow roughly.
Black is 6 port Renesis, grey is 4 port Renesis, pink is s5 6 port. All three of these engines have variable length intake runners (VDI system). The 4 port Renesis is very different from the old Rx-7 4 port engines. I imagine your typical street ported 4 port rotary has poor VE under about 3000-4000rpm, with enhanced VE at the top end. Using a fixed VE % doesn't make these calculations useless but it's certainly a limitation.
It's not a 13B, but here is a plot of a prototype single turbo 20B that Mazda made (couldn't find anything like this for a 13B). This single turbo has output equivalent to the 20B sequential twins. The only spec given is that this compressor wheel has a 72mm exducer.
I believe the airflow units are in grams/sec * 100 , where each "1" on this chart would correspond to about 13.2 lb/min airflow roughly.
Thread Starter
Joined: Sep 2006
Posts: 150
Likes: 1
From: Louisville, Kentucky
Obviously, the calculations are very simplistic. I put these together in an hour or two. Maybe I can spend some time next week trying to refine the numbers.
That 20B plot is cool, shows exactly what I was trying to find.
That 20B plot is cool, shows exactly what I was trying to find.
only assumption I'm unsure of, is the difference between flow levels at each pressure ratio. The author on that website essentially took the naturally aspirated flow level, and multiplied by the pressure ratio. This means that the rise in air flow with pressure increase is linear. I don't have enough of a background to know whether this is the case, or whether it should be different.
Really hard to do all this math without hard factual numbers instead of just educated guesswork. Keep in mind that above 24psi or so you need a bigger turbine wheel than a P trim( found on the TD61 and To4Z).

Thread Starter
Joined: Sep 2006
Posts: 150
Likes: 1
From: Louisville, Kentucky
I've always been under the impression that its close, but not linear.
Really hard to do all this math without hard factual numbers instead of just educated guesswork. Keep in mind that above 24psi or so you need a bigger turbine wheel than a P trim( found on the TD61 and To4Z).
Really hard to do all this math without hard factual numbers instead of just educated guesswork. Keep in mind that above 24psi or so you need a bigger turbine wheel than a P trim( found on the TD61 and To4Z).
It would be extremely difficult to be exact and almost pointless for what I'm trying to accomplish. I was just looking around at other people's setups, etc. and I couldn't find any technical information. Basically, all I was seeing is 'well this has worked in the past' and 'so and so made xxx whp on xxxxx turbo'. I wanted a better explanation to see what the potential and limitations of turbos were.
I'm hoping that we can get some knowledgeable forum members, like yourself, to contribute and refine the methodology.
So the P trim turbine wheel is standard on the TD61 and the T04Z? Can they be outfitted with others? I was under the impression that it wouldn't matter anyways. That compressor map is individual to THAT compressor wheel without regard to the turbine wheel.
A bigger turbine reduces the backpressure on the exhaust which changes the VE of the engine which changes where your plot would be on the compressor map. 
Trying to figure out what turbo you want solely on VE calculations is extremely difficult. I know you dont seem to like the idea of looking at other peoples setups but thats really what you have to do. Everyone builds there cars differently and turbo's will work differently based upon that.
The only realistic way of calculating VE is on a stock engine where I believe the VE is already known. Once you add porting into that, VE "almost" becomes useless as ported engines are done by hand with different port timing and port hole shapes. No one engine is going to perform the same and have the exact same VE.
thewird

Trending Topics
To make your estimations better get some datalog of T61/ptrim 1.0 or 1.15 cars, and notice that the spool is basically right through the centre (maximum efficiency). I used to be 100% sure that 60-1 was better than t61 under 20psi but now I'm not so sure, basically the efficiency is better and the wheel size/weight will not be that much bigger.
A bigger compressor wheel from that base (T67/Z/R) will spool slower, make less power at all rpm until it is within 1-2psi of the smaller compressor'd turbo. I don't think the power will crossover until 5000rpm.
I can give you factual 12Hz data of how a vtrim/highflow bnr style spools on the road.
On a 12a street port with 9.4:1 compression I see 0.9Bar at 3000rpm. 1.2Bar at 3950rpm. Backpressure has won the fight at 7400rpm.
Your raw airflow values are way low (because most guys you are basing your test data off us the HC / US spec dynos that call BHP rwhp).
17-20psi on a T61/Z will be moving 65+lb/min @ 7600rpm.
65lb/min on a good engine = 440rwhp or so = 9.99 - 10.99 bracket street car on slicks.
When yanks talk about 500rwhp usually means 10.5 or slower cars with balooned up dyno figures.
When you talk in TRUE rwhp, as measured on an honest chassis dyno, that is measuring the power delivered, and not being manipulated 290rwhp can run 10.99 in a 1st gen. Take a look at https://www.rx7club.com/showpost.php...5&postcount=15
360 genuine rwhp = 11.80 @ ~120mph in a heavy FC3S. Look at the MPH that genuine FD3S gt35r (normal 1.06 T3 gt35r's) pull. You will see they are ~126mph and depending on slicks conditions, track driver, are doing mid 10s or slower like 11.50 etc. Science correctly measures that as 440rwhp or so, but all this dynolog/dynapak/mainline/dynodynamics/mustang blah blah.
The measurement is useless as an absolute quantity if it is incorrectly or misleadingly calibrated
dyno's are more of a tunning tool imo
I'm currently trying to decide on which turbo I want, so I've been doing a lot of reading. While looking around today I came across this website:
http://www.mygen.com/users/dbruce/my...sor%20Maps.htm
I hadn't ever seen this kind of plotting done for a 13B, so I decided to give it a shot.
I used a 158.6 CI displacement and a 90% VE for a streetported motor (found in another thread, not sure on validity) and a conservative 7500 RPM redline.
I assumed the formula's he used in his calculations are accurate as I believe I had seen them elsewhere before. The only assumption I'm unsure of, is the difference between flow levels at each pressure ratio. The author on that website essentially took the naturally aspirated flow level, and multiplied by the pressure ratio. This means that the rise in air flow with pressure increase is linear. I don't have enough of a background to know whether this is the case, or whether it should be different. I haven't had a chance to do some researching either. Even if it increases exponentially or something of the like, it should be easy to make that change in the calculations I made.
Here they are:
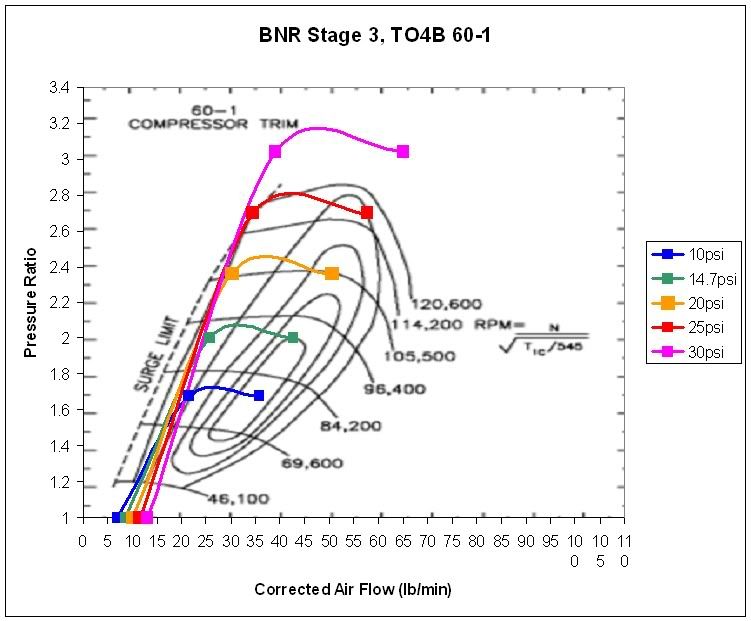
I thought the BNR plots were interesting. The 60-1 Wheel looks like a great match between 10 and maybe 22-23 PSI.
The TD61 seems like a great choice also. Pretty much all of the lines go right through the central efficiency range of the turbo.
As you can see on the T04Z plot, besides the 30 PSI point, the other 7500 RPM points are VERY close to that dashed line in the middle of the compressor map, which is interesting as well.
Discuss.
PS- I can also send the spreadsheet to anyone who wants to play around with the numbers/plots.
http://www.mygen.com/users/dbruce/my...sor%20Maps.htm
I hadn't ever seen this kind of plotting done for a 13B, so I decided to give it a shot.
I used a 158.6 CI displacement and a 90% VE for a streetported motor (found in another thread, not sure on validity) and a conservative 7500 RPM redline.
I assumed the formula's he used in his calculations are accurate as I believe I had seen them elsewhere before. The only assumption I'm unsure of, is the difference between flow levels at each pressure ratio. The author on that website essentially took the naturally aspirated flow level, and multiplied by the pressure ratio. This means that the rise in air flow with pressure increase is linear. I don't have enough of a background to know whether this is the case, or whether it should be different. I haven't had a chance to do some researching either. Even if it increases exponentially or something of the like, it should be easy to make that change in the calculations I made.
Here they are:
I thought the BNR plots were interesting. The 60-1 Wheel looks like a great match between 10 and maybe 22-23 PSI.
The TD61 seems like a great choice also. Pretty much all of the lines go right through the central efficiency range of the turbo.
As you can see on the T04Z plot, besides the 30 PSI point, the other 7500 RPM points are VERY close to that dashed line in the middle of the compressor map, which is interesting as well.
Discuss.
PS- I can also send the spreadsheet to anyone who wants to play around with the numbers/plots.
- VE will vary base off rpm like mentioned earlier. Non-ported motors i feel are more around .9 with highly modified engines running upwards of 1.10
- Your PR will vary based off RPM and what boost you plan to run (obviously)
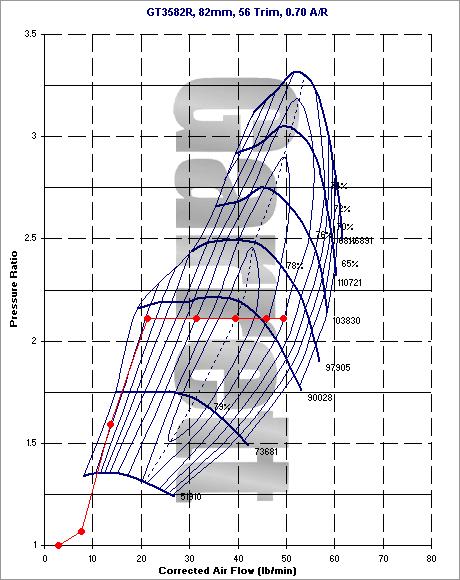
So get the lbs/min and PR and throw it at a compressor map and see how it looks (green bands are key power areas i plot). This way you can see where you are in the efficiency of the turbo give the rpm of your engine.
The rwhp is the ball park you're playing in.
The second pic is what I do if I want to see what back pressure i'm up against and there you can see where i typically plot my points

Hoo Hoo Hoosiers

Joined: Nov 2010
Posts: 72
Likes: 3
From: Austin, TX
I use something like this
- VE will vary base off rpm like mentioned earlier. Non-ported motors i feel are more around .9 with highly modified engines running upwards of 1.10
- Your PR will vary based off RPM and what boost you plan to run (obviously)
So get the lbs/min and PR and throw it at a compressor map and see how it looks (green bands are key power areas i plot). This way you can see where you are in the efficiency of the turbo give the rpm of your engine.
The rwhp is the ball park you're playing in.
The second pic is what I do if I want to see what back pressure i'm up against and there you can see where i typically plot my points
The only assumption I'm unsure of, is the difference between flow levels at each pressure ratio. The author on that website essentially took the naturally aspirated flow level, and multiplied by the pressure ratio. This means that the rise in air flow with pressure increase is linear. I don't have enough of a background to know whether this is the case, or whether it should be different.
It would be more accurate to characterize it as a "density ratio," as opposed to pressure ratio. If there is no temperature change, then p/r = density ratio.
Senior Member
Joined: Nov 2008
Posts: 357
Likes: 0
From: Czech republic
As already mentioned, NA mass flow is too low. For comparison, stock unmodified Renesis, even with its restrictive exhaust ports, flows about 200 g/sec (26.4 lbs/min) @ 7500 rpms. Street ported 13B will be very similar. Intake/exhaust pressure ratio also has quite big impact on VE and should be taken into consideration, but its just guessing without hard data or programs which could compute pumping losses and final VE.
Volumetric efficiency is affected by many things and absolute number is just assumption till you precisely measure air mass flow, or fuel flow coupled with AFR (there are more options, engine power, BSFC...) and of course, values must be converted and corrected for given inlet conditions - different temperatures, pressures and humidity.
For example:
According to my math, R26B four rotor at peak torque, is working somewhere between 129-136% VE. I can�t be certain, as I don�t have enough data. Horsepower and BSFC in this point is known, but without actual air/fuel ratio, actual airflow is unknown. We can just guesstimate with usual AFRs giving good power in NA engine and this puts us in above range

On street ported engine with good ratio between intake and exhaust pressure, I would say as much as 110% at peak torque and under 100% at peak power.
To bad that 13B doesn�t have mass flow sensor, it would be nice reference tool, much better than boost and it would show better boost control strategies, especially on choked applications, but what do I know
Volumetric efficiency is affected by many things and absolute number is just assumption till you precisely measure air mass flow, or fuel flow coupled with AFR (there are more options, engine power, BSFC...) and of course, values must be converted and corrected for given inlet conditions - different temperatures, pressures and humidity.
For example:
According to my math, R26B four rotor at peak torque, is working somewhere between 129-136% VE. I can�t be certain, as I don�t have enough data. Horsepower and BSFC in this point is known, but without actual air/fuel ratio, actual airflow is unknown. We can just guesstimate with usual AFRs giving good power in NA engine and this puts us in above range
On street ported engine with good ratio between intake and exhaust pressure, I would say as much as 110% at peak torque and under 100% at peak power.
To bad that 13B doesn�t have mass flow sensor, it would be nice reference tool, much better than boost and it would show better boost control strategies, especially on choked applications, but what do I know

Junior Member
Joined: Dec 2012
Posts: 6
Likes: 0
From: San Diego, Ca
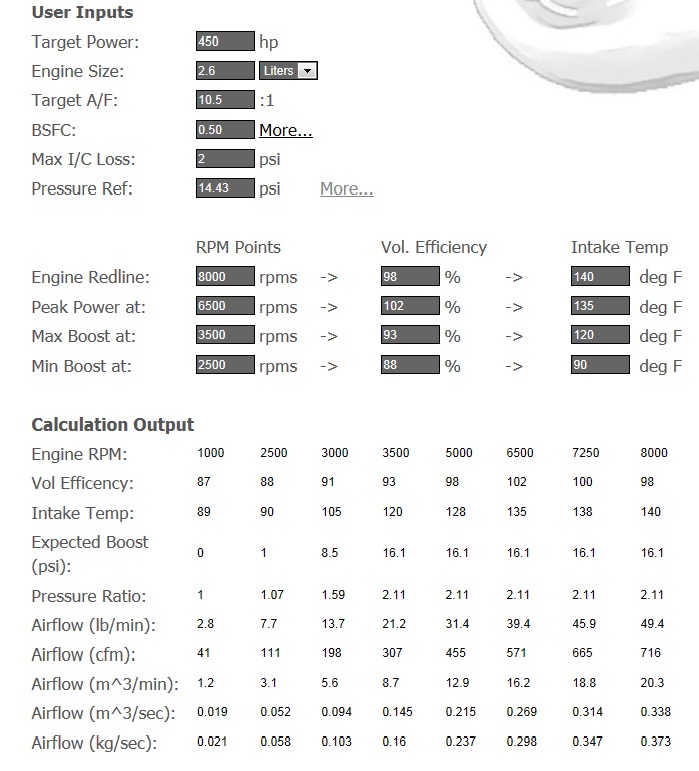
What about using a calc like this one:
Squirrel Performance
it is setup for variable VE based on 4 different RPM's: Redline, max power, max boost, beggining boost.
Check this out:
GT3582R
T04B 62-1
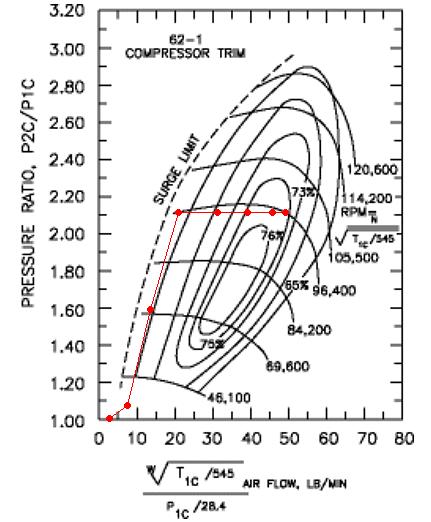
I think it looks fairly accurate. I fudged a few number to get the target boost I wanted, hence the BSFC being lower than probably typical, and a/f richer.
Squirrel Performance
it is setup for variable VE based on 4 different RPM's: Redline, max power, max boost, beggining boost.
Check this out:
GT3582R
T04B 62-1
I think it looks fairly accurate. I fudged a few number to get the target boost I wanted, hence the BSFC being lower than probably typical, and a/f richer.
Last edited by TheKid760; Dec 23, 2012 at 03:26 PM.

Thread
Thread Starter
Forum
Replies
Last Post
KAL797
Test Area 51
0
Aug 11, 2015 03:47 PM