
Geez! chassis plots from events this season

Thread Starter
Lives on the Forum
Joined: Feb 2001
Posts: 9,617
Likes: 8
From: Dallas
Geez! plot from first event of the season
This was not my fastest run of the day and I was still dealing with some push due to increased negative camber in the front end; took me a few runs to get tire pressure worked out. Along with many, many other things Geez! can figure "total G" by summing all the acceleration forces. To keep that value a perfect 100% you would have to be at threshold braking, accelerating so hard you're at the verge of wheelspin or mixing the two with turning. Perfection of this would show the tire constantly running on the outside of the friction circle except for hard transitions in cornering or braking/acceleration where you would want to see the graph be flat from left to right or top to bottom during transition. Think of "total G" as how much of the tires' ability are being used. On this graph over 90% is light blue, 80%-89% is dark blue and anything less than 80% is violet.
Anywhere on this map that isn't light blue means I am not using as much of the tire as I should. The only areas where that is not my fault as a driver are on hard acceleration areas in a straight line where the car doesn't have enough power to break the tires loose. The car is accelerating as fast as its engine power allows, but the tires are capable of accepting more acceleration than the engine can give. The beginning of this graph is at the lower left and the course extends in a clockwise direction.
I did do one corner absolutely perfectly though. You have to start somewhere; right? If you locate the small white bullseye on the map at 30 seconds this will be the point on the map represented by the red bullseye in the friction circle and the red bar on the charts. At his point I am exiting a high speed slalom on the left side, slowing hard and entering a sharp right turn. The red bullseye in the friction circle shows me at max braking but if you look to either side of that bullseye you can see the trace follows the outer edge of the circle nearly perfectly. This means I matched my braking, turning and then acceleration out perfectly to the limits of the tire. There's plenty of other spots on this map that show room for improvement
  I had much better runs later in the day but this one is a good example that allows you to judge your performance.
Anywhere on this map that isn't light blue means I am not using as much of the tire as I should. The only areas where that is not my fault as a driver are on hard acceleration areas in a straight line where the car doesn't have enough power to break the tires loose. The car is accelerating as fast as its engine power allows, but the tires are capable of accepting more acceleration than the engine can give. The beginning of this graph is at the lower left and the course extends in a clockwise direction.
I did do one corner absolutely perfectly though. You have to start somewhere; right?
If you locate the small white bullseye on the map at 30 seconds this will be the point on the map represented by the red bullseye in the friction circle and the red bar on the charts. At his point I am exiting a high speed slalom on the left side, slowing hard and entering a sharp right turn. The red bullseye in the friction circle shows me at max braking but if you look to either side of that bullseye you can see the trace follows the outer edge of the circle nearly perfectly. This means I matched my braking, turning and then acceleration out perfectly to the limits of the tire. There's plenty of other spots on this map that show room for improvement I had much better runs later in the day but this one is a good example that allows you to judge your performance.
Thread Starter
Lives on the Forum
Joined: Feb 2001
Posts: 9,617
Likes: 8
From: Dallas
Originally posted by gfelber
Is there anything special with regard to setting up Geez! for rotary applications (e.g., RPM)?
Thanks,
Gene
Is there anything special with regard to setting up Geez! for rotary applications (e.g., RPM)?
Thanks,
Gene
Geez gets all of its data from the 2" cube which is just velcroed inside the car somewhere; there is no actual interface with the car other than the fact that the cube is mounted to it. Geez measures acceleration in the x and y directions and counts time; that is all it does. The software however is extremely adept at interpreting this into useful data; like speed and RPM for instance. The software can figure out you accelerated in a certain direction at a certain rate for a certain time and therefore it can determine speed (this is also how it generates its track maps). Since the software is programmed with my transmission ratios, final drive and tire size it can therefore tell me what rpm I was it for a given gear since it already figured out my speed. You can even play back the maps with different gear ratios or in different gears to see if perhaps you would like to make a change.
Thread Starter
Lives on the Forum
Joined: Feb 2001
Posts: 9,617
Likes: 8
From: Dallas
Don, you gotta go buy one of these. Even if I never improve as a driver with Geez I will have more fun doing it because I enjoy studying this stuff  The screenshot really doesn't tell you at all what this package is capable of. Synching four runs together and playing them back in real time shows you right off the bat where you were good and bad each time. Then you can go into each of those spots further and look at the numbers to figure out WHY you were good or bad. I'm still trying to develop a protocol for myself in how I systematically interpret the data for each run. I have a good understanding of how Geez works but even with this "simple" package the amount of data is pretty incredible.
I was prepared to buy the whole thing brand new for this season but figured I would check ebay before picking up the phone. To my big suprise somebody was selling a slightly used package (looks brand new to me) and my winning bid was less than half price! That will never happen again!
Too bad you can't find race tires like that
The screenshot really doesn't tell you at all what this package is capable of. Synching four runs together and playing them back in real time shows you right off the bat where you were good and bad each time. Then you can go into each of those spots further and look at the numbers to figure out WHY you were good or bad. I'm still trying to develop a protocol for myself in how I systematically interpret the data for each run. I have a good understanding of how Geez works but even with this "simple" package the amount of data is pretty incredible.I was prepared to buy the whole thing brand new for this season but figured I would check ebay before picking up the phone. To my big suprise somebody was selling a slightly used package (looks brand new to me) and my winning bid was less than half price!
That will never happen again!Too bad you can't find race tires like that
Trending Topics
Thread Starter
Lives on the Forum
Joined: Feb 2001
Posts: 9,617
Likes: 8
From: Dallas
Thread Starter
Lives on the Forum
Joined: Feb 2001
Posts: 9,617
Likes: 8
From: Dallas
Originally posted by Umrswimr
One question- how did you determing what the maximum friction point is for the tires?
One question- how did you determing what the maximum friction point is for the tires?
Geez will give absolute and sustained G readings for each run. My fastest run of the day also had the highest peaks; makes sense. An absolute reading is a spike in the data and a sustained reading I have set to read over a period of .5 seconds. My biggest cornering spike was 1.16 g and I was able to sustain 1.1+ g in several sweepers. There were only a couple places were I had to brake hard and I saw braking g's of .99 g. All of this in Mineral Wells on last year's tires. General consensus amongst us was the course felt a little slick that day as well.
I will have new tires shortly and will scrub them in and do some testing before the Houston National Tour first weekend of April. If the car is doing 1.1 g on old tires on not the best surface Houston should prove interesting.
LS6 Convert
Joined: Jan 2002
Posts: 1,827
Likes: 0
From: Austin, TX
Originally posted by DamonB
Don, you gotta go buy one of these. Even if I never improve as a driver with Geez I will have more fun doing it because I enjoy studying this stuff .........
Don, you gotta go buy one of these. Even if I never improve as a driver with Geez I will have more fun doing it because I enjoy studying this stuff
......... Maybe next year.
DFW Drunk by Proxy
Joined: Apr 2002
Posts: 2,291
Likes: 0
From: Valley Ranch, Tx
Originally posted by DamonB
The user doesn't set any limits on the charts; Geez determines all of that. Imagine a very simple case of lapping a skidpad. The lateral accelerometer in that case can easily compute max G (maximum grip) because past that point the car will begin sliding and grip (g) will go down; it works the same way in a straight line too.
The user doesn't set any limits on the charts; Geez determines all of that. Imagine a very simple case of lapping a skidpad. The lateral accelerometer in that case can easily compute max G (maximum grip) because past that point the car will begin sliding and grip (g) will go down; it works the same way in a straight line too.

Thread Starter
Lives on the Forum
Joined: Feb 2001
Posts: 9,617
Likes: 8
From: Dallas
I see where you're going and I will have to email Byron to get a true answer; somehow Geez does know and is right. I suspect it computes "grip potential" exactly as you say: by finding the points where g values begin to decline. That does not mean you have to lock tires or slide the car: Grip begins declining once you pass through the optimum slip angle, but you have to press further to actually slide the car. Therefore Geez could know the traction budget without the driver actually sliding the car or locking tires. That would have to be how any device works; it's the only way it can possibly know and it wouldn't be ambiguous at all. The values computed in this way would always represent conditions present at the time since the traction budget is computed at all times. Still very interesting though; we'll see what Byron says happens if as a for instance it's only raining on half the course.
This pic below is from the other thread and it shows the same stretch of road; wet on the left and dry on the right. The graphs themselves look much the same but the numerical values are different due to increased grip in the dry. The wet run has some light blue which shows my using 90%+ of the grip available; the dry run is all red which shows I'm using less than 70% of the grip available. Both runs were made at about the same speed and yet Geez knows that in the wet I was using more of the tires' potential even though my actual g values were lower than in the dry.
This pic below is from the other thread and it shows the same stretch of road; wet on the left and dry on the right. The graphs themselves look much the same but the numerical values are different due to increased grip in the dry. The wet run has some light blue which shows my using 90%+ of the grip available; the dry run is all red which shows I'm using less than 70% of the grip available. Both runs were made at about the same speed and yet Geez knows that in the wet I was using more of the tires' potential even though my actual g values were lower than in the dry.
DFW Drunk by Proxy
Joined: Apr 2002
Posts: 2,291
Likes: 0
From: Valley Ranch, Tx
Wow...
Ok, that plot of yours is pretty convincing... Both sections were driven at the same speed, only one in the wet and another in the dry? Any chance you have a fullsize pic so I can read it a little more closely? Email if you want.
At any rate, that's pretty amazing that it can determine the traction limit under different condiditons with just a few accelerometers. I'd be curious as to exacly how they do it and how accurate it is (and how would you test its accuracy, anyway?) Even if it's 20% off, its still tool to compare runs and figure out where you can improve.
Thread Starter
Lives on the Forum
Joined: Feb 2001
Posts: 9,617
Likes: 8
From: Dallas
Originally posted by Umrswimr
Both sections were driven at the same speed, only one in the wet and another in the dry?
Both sections were driven at the same speed, only one in the wet and another in the dry?
Your question about how Geez computes grip potential got me thinking too. I emailed Byron; it'll be interesting to see what he says.
I can email you a larger pic but it won't really help you as without having the software on your computer you can't tap into the hard data for comparison. You can download the complete Geez! demo program for free at www.extremegeez.com. The program is fully functional except it won't allow you to download your own info into it; you must use the samples already provided. Every feature and function is enabled in the demo, you just have to use the sample runs saved in it already.
Thread Starter
Lives on the Forum
Joined: Feb 2001
Posts: 9,617
Likes: 8
From: Dallas
My email to Byron; creator of Geez!:
I used Geez for the first time in competition and as with anything else have some questions even though I thought I already understood =)
How exactly does Geez KNOW usage? My guess is that it looks for the point where the tires exceed the ideal slip angle and grip declines; thus geez knows the highest amount of grip available. If this is true then if I go putt-putt around the course at 10 mph Geez wouldn't be able to know how much grip is truly available since I wasn't pushing the tires?
To go one step further what would happen on a multilap run if it began to rain? Does Geez somehow know the grip of the surface declined or does it just feel that the car was not being pushed as hard since it saw much higher values earlier in the same run?
Thanks.
-Damon
Byron replies:
Damon,
For a good nuts and bolts definition, go to Help | Technical Definitions
| Usage. There is also a decent discussion there about how it works
beyond just the definition.
But to answer your 10mph question: try it! You'll get a very low GEEZ
score. Here's why...
GEEZ sets the max left, right, brake and acceleration g's based on your
car's own results from that particular run. We assume that you will be
up against the friction limit somewhere on the run, so we'll have a good
look at what that is. So if you do an ultra slow run, you produce
nothing but low g-levels, and those become your maximums. So far so
good. But there's a problem. Let's say that you set your g level
maximums at 0.10 g's all the way around. Easy, to stay in there,
right? WRONG-O! It's very, very hard to stay right up against 0.10g's
all the time. If you miss that by only 0.05 g, you will score 50%
Usage, which is as low as wel let the computer go. (Politically Correct
of us, don't you agree?) By comparison, consider what would happen if
your peak g's were set at 1.20 g's and you miss that by 0.05. You are
then at 96% Usage.
However, there IS a great lesson to be learned in driving smoothly,
though not slowly. It is possible to score high scores by driving
extremely consistenly and smoothly at the vehicle's limit. I've even
seen some drivers who could teach themselves to produce 99% runs
(sustained peaks, adjusted ratings) relatively easily, but could go
faster when they gave up smoothness and dropped scores to 95% or so.
But this is rare and unusual, and learning to do it means that you've
learned the real magic of what GEEZ presents. Once you do that, I
suggest changing your settings back to absolute peaks and unadjusted
ratings, and refining your game some more.
Regarding your question about multi-lap runs... GEEZ views each lap of
a multi-lap run as a separate run, so Usage maximums are computer per
lap. If it rains on a particular lap, your g levels go down on that one
lap, but your score may not, if you are staying sufficiently at the
vehicle's new, diminished friction circle.
Now if it rains on one side of the track but not the other...
I've forwarded this along to the GEEZ list, in case folks want to chime
in with other observations.
--Byron
Airflow is my life
Joined: Aug 2002
Posts: 6,736
Likes: 2
From: Orlando, Fl
Interesting, but what if your running at a track that is multi surfaced? Concrete and asphault? It sounds to me that it computes a single max G number for grip on a specific lap. Then what if on a bumpy section, or a spot that has low grip due to a different road surface you drive at the limit for that section? It will still show under max usage right? So youd have to adjust your interpretation based on this ?
Thread Starter
Lives on the Forum
Joined: Feb 2001
Posts: 9,617
Likes: 8
From: Dallas
Originally posted by Rx7carl
Interesting, but what if your running at a track that is multi surfaced? Concrete and asphault?....It will still show under max usage right? So youd have to adjust your interpretation based on this ?
Interesting, but what if your running at a track that is multi surfaced? Concrete and asphault?....It will still show under max usage right? So youd have to adjust your interpretation based on this ?
Higher usage scores on that track absolutely mean you used the most of the grip available. Geez determines usage just as Byron described in the email and so if it were raining on only half the track your usage values will go down. You of course as the driver know this and will have to take that into account. FWIW this would be true of any software as it can only interpret grip through what it sees the tires doing, it can't actually reach out and measure the cf of the surface at every spot around the course.
Did I make sense?
Thread Starter
Lives on the Forum
Joined: Feb 2001
Posts: 9,617
Likes: 8
From: Dallas
Geez! plot from third event
Here's data from my best run at the third event of the season (I don't have data for the second event due to operator error. The operator has since figured out how he screwed it up ). First off the car has been changed: it's on brand new race tires. The car is hooked up better than it ever has been but I'm still timid of pushing it hard in tight slaloms and Geez is agreeing with me on that. The first things to go away on tires are exit speed and the ability to stick through hard transitions and therefore I'm not letting myself trust the new tires enough. I spent a whole day of testing teaching myself to get back on the throttle earlier because the new tires will hold it along with convincing myself to drive it harder through slaloms. Geez shows me I am still giving up too much time in the slaloms and not exiting turns hard enough.
This course was big and fast; fun to drive. I lost first place to a well driven Z06 by .2 seconds on a 76 second course; that means I was 99.7% as fast as first place. We're always looking for tiny bits of time, right?
The course begins with short left into a very tight 30 mph right hander. Then there's plenty of room to accelerate before entering a big 4 cone slalom that is slightly offset. The key is to be patient in the right hander but to jump on the power hard as soon as you come around. At entry to the slalom I'm doing about 55 mph and still accelerating; upshifting to third just before clearing the last gate and carrying just over 70mph into the first left hand sweeper before downshifting back to second under braking. I felt I was giving up time through this slalom on every run but I was timid because:
A) I'm still learning the new tires.
B) This is the beginning of the run and the tires are cold.
C) This is the beginnig of the run and I don't want to screw it up right away
The colors plotted on the track map are the same as always. Tire usage over 90% is light blue, from 80%-89% is dark blue, 70%-79% is pink and anything under 70% is red. Ideally we want the whole map to be light blue The chart on the left is tire usage with the beginning of the run starting at the top. If a robot could drive the tires perfectly you'd get a straight line down the extreme right side of the chart; 100% usage. Each spike to the left means you didn't use all the tire's grip at that point on the track. The red line on the chart coincides with the bullseye on the map; this is the entrance to the slalom that I felt I was taking too slowly. The portion of the chart circled in green is the period of time I was passing through the slalom. Right away I can see I did it too slow as my usage in the chart shows a "clump" of low readings that also show on the map by the fact nearly the entire slalom is drawn in red: I was only using 70% (or less!) of what the tires had at that point! That's terrible! If I had a laptop at the track and could have known this right off the bat you can bet I would have had my .2 seconds and taken first place!
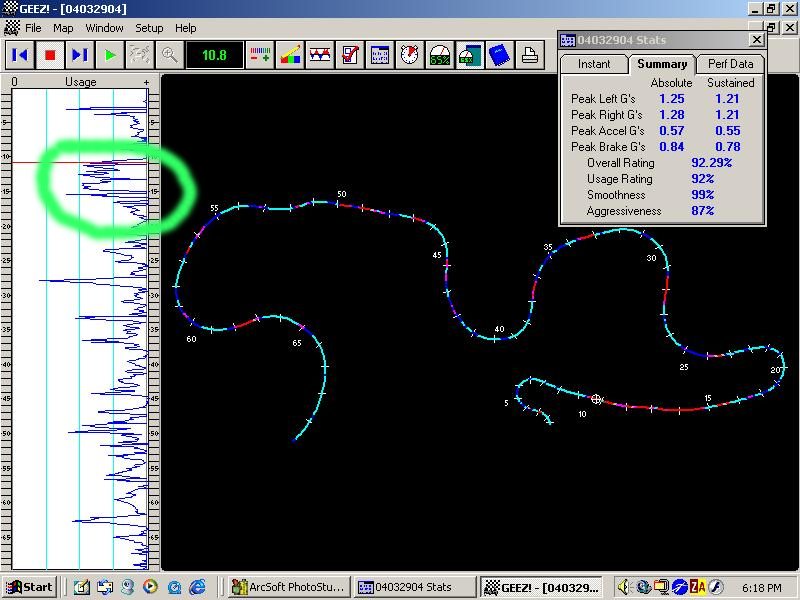
The other red spots on the map are all short connecting straights. These are telling me I didn't get on the gas as early as I could have in the previous corner and so exited slower than I could have. On very tight courses the red sections in straightaways don't concern me, they're showing me turbo lag. This course however had no small turns and I never had to lug the car around, so those red spots are me not gassing it early enough (my low aggressiveness rating shows me that too).
). First off the car has been changed: it's on brand new race tires. The car is hooked up better than it ever has been but I'm still timid of pushing it hard in tight slaloms and Geez is agreeing with me on that. The first things to go away on tires are exit speed and the ability to stick through hard transitions and therefore I'm not letting myself trust the new tires enough. I spent a whole day of testing teaching myself to get back on the throttle earlier because the new tires will hold it along with convincing myself to drive it harder through slaloms. Geez shows me I am still giving up too much time in the slaloms and not exiting turns hard enough.This course was big and fast; fun to drive. I lost first place to a well driven Z06 by .2 seconds on a 76 second course; that means I was 99.7% as fast as first place. We're always looking for tiny bits of time, right?
The course begins with short left into a very tight 30 mph right hander. Then there's plenty of room to accelerate before entering a big 4 cone slalom that is slightly offset. The key is to be patient in the right hander but to jump on the power hard as soon as you come around. At entry to the slalom I'm doing about 55 mph and still accelerating; upshifting to third just before clearing the last gate and carrying just over 70mph into the first left hand sweeper before downshifting back to second under braking. I felt I was giving up time through this slalom on every run but I was timid because:
A) I'm still learning the new tires.
B) This is the beginning of the run and the tires are cold.
C) This is the beginnig of the run and I don't want to screw it up right away
The colors plotted on the track map are the same as always. Tire usage over 90% is light blue, from 80%-89% is dark blue, 70%-79% is pink and anything under 70% is red. Ideally we want the whole map to be light blue
The chart on the left is tire usage with the beginning of the run starting at the top. If a robot could drive the tires perfectly you'd get a straight line down the extreme right side of the chart; 100% usage. Each spike to the left means you didn't use all the tire's grip at that point on the track. The red line on the chart coincides with the bullseye on the map; this is the entrance to the slalom that I felt I was taking too slowly. The portion of the chart circled in green is the period of time I was passing through the slalom. Right away I can see I did it too slow as my usage in the chart shows a "clump" of low readings that also show on the map by the fact nearly the entire slalom is drawn in red: I was only using 70% (or less!) of what the tires had at that point! That's terrible! If I had a laptop at the track and could have known this right off the bat you can bet I would have had my .2 seconds and taken first place!The other red spots on the map are all short connecting straights. These are telling me I didn't get on the gas as early as I could have in the previous corner and so exited slower than I could have. On very tight courses the red sections in straightaways don't concern me, they're showing me turbo lag. This course however had no small turns and I never had to lug the car around, so those red spots are me not gassing it early enough (my low aggressiveness rating shows me that too).
Thread Starter
Lives on the Forum
Joined: Feb 2001
Posts: 9,617
Likes: 8
From: Dallas
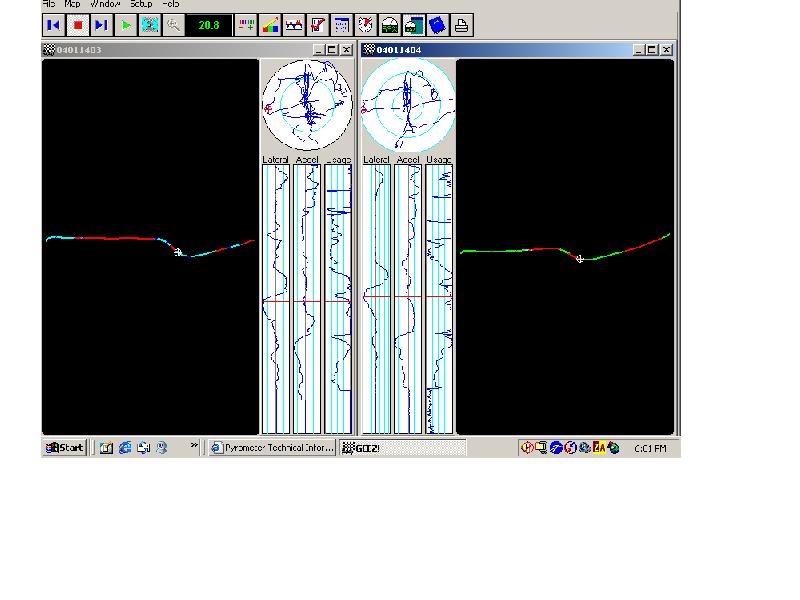
Here's how I have improved in the span of a few weeks since I have started using Geez. The colors on both charts are nearly the same: Usage over 90% is light blue and from 80% to 89% is dark blue.
Here's the map from my first event this season:
And here's the one again from my third event:
LOTS more tire usage in that last one Consider in that same time I've changed tires and suspension settings and am still learning to get everything out of the new setup. By datalogging my track time though I can see right away what I need to fix and I made a big improvement due to the fact I know where I am underdriving the car; regardless of the fact that I have made changes to the car. This last event I was not driving out of control with my heart pounding, I was applying a plan that was formulated from review of the data I have of my previous driving. When you KNOW what you're doing wrong you can fix it.
Here's the map from my first event this season:
And here's the one again from my third event:
LOTS more tire usage in that last one
Consider in that same time I've changed tires and suspension settings and am still learning to get everything out of the new setup. By datalogging my track time though I can see right away what I need to fix and I made a big improvement due to the fact I know where I am underdriving the car; regardless of the fact that I have made changes to the car. This last event I was not driving out of control with my heart pounding, I was applying a plan that was formulated from review of the data I have of my previous driving. When you KNOW what you're doing wrong you can fix it.
Thread Starter
Lives on the Forum
Joined: Feb 2001
Posts: 9,617
Likes: 8
From: Dallas
Geez! plot from third event
For grins here's the same map again. This time everywhere I was using 95% or more of the tires is green, everything else is red. These show my small flourishes of excellence
Thread Starter
Lives on the Forum
Joined: Feb 2001
Posts: 9,617
Likes: 8
From: Dallas
Geez! plot from third event
Another analysis of the same map. This time everything over 75% acceleration shows green and everything over 75% braking shows red. This shows where I was accelerating hardest and braking hardest.
Comparing this particular scheme with my other runs of the day is interesting. More green shows more hard acceleration but my higher speeds then dictate I brake more for the following corners. On my "slow" runs there were areas I didn't need to brake, but on my fast runs my higher speed needed me to slow the car before the next corner. My fastest runs actually had more hard braking.
Comparing this particular scheme with my other runs of the day is interesting. More green shows more hard acceleration but my higher speeds then dictate I brake more for the following corners. On my "slow" runs there were areas I didn't need to brake, but on my fast runs my higher speed needed me to slow the car before the next corner. My fastest runs actually had more hard braking.

Rotary Enthusiast
Joined: Dec 2001
Posts: 1,252
Likes: 0
From: Sunnyvale, CA
This is very interesting. I am also looking for ways to improve my driving, specially when I am new to race tires now.
I have some questions:
How do you know you are using 95% or more of the tires?
Does the software knows the maximum tire capability?
I have some questions:
How do you know you are using 95% or more of the tires?
Does the software knows the maximum tire capability?