When you click on links to various merchants on this site and make a purchase, this can result in this site earning a commission. Affiliate programs and affiliations include, but are not limited to, the eBay Partner Network.
I wanted to make a post to detail how I use Megalogviewer (MLV) to work a fuel map. I've been extremely successful in using this method now across 15-16 FD RX7's ranging from stock port twin turbo pump gas cars to my current semi peripheral big turbo E85 FD. I find its extremely useful for both the new and advanced tuner and can used by either with extreme ease.
This is of my methods I've come to use when tuning a fuel map and is meant to serve as a guide for those who wish to lean. If you don�t like it, or do something else�that is great for you, but this thread needs to stay focused on MLV and how it can be used to tune, specifically a fuel map. The first thing you'll need to do is buy Megalogviewer HD here:
I think its $29.99 or $39.99 for a lifetime license. They have a free version, but until you pay and plug in the registration code you will be severely limited in the log size you can run so you really need to buy the software.
Once you have access you will load a log through file and open then head over to the Histogram/Table Generator Page and set up the chart axis to match your main fuel map scale for both load (MAP) and RPM. You click on the box shown below and then enter the values then hit apply and ok to apply them to the table. Next you'll want to go to the top left corner and setup the X and Y axis. In my case with the Haltech Elite I am using Y and the RPM Axis and X for the MAP Axis. Different ECU's log in different units with different formats, so I'll leave you to figure out how to best align this with your fuel map.
On the Haltech, the data from your wideband and target AFR is actually logged in lambda, so in order to see it in AFR you will have to set up some custom fields in MLV. It also logs pressure in kPa, so you'll need to make a custom field for MAP in PSI. (Images borrowed from Havoc, sure he won't mind).
The catch here with converting the kPa reading using the units above to "MAP in PSI" is that you literally converted the vacuum region to PSI as well, so it won't match the inHg reading in your table. In order to scale the PSI values to accurately reflect the inHg columns in your fuel table, you simply use google to fine the value in PSI that corresponds to the inHg value in your table, then set up your table accordingly. Everything in PSI in the positive pressure region will be accurate for PSI and doesn't not require further scaling.
The Z axis is the data that you actually want to plot on the chart. You can set it to output any reading from the log and then see what the AVERAGE OF ALL log data recorded in that cell was. I use this to check knock, AFR, injector duty cycles, fuel pressure, etc. As this operates as an average you need to record your log data with that in mind. When I am going to be using AFR data to tune the fuel map, I don't start the log until the car is fully warmed up so that the AFR readings aren't skewed by coolant trims during warmup. There are filters built into MLV that can filter this data out, but I prefer to simply start my log once warm.
The Delta Z axis allows you to show a difference between the dataset you have plotted on the Z Axis and another one you select here. I use this to show the difference between the ACTUAL AFR logged by the wideband sensor and the TARGET AFR as set by the target table in the tune. This effectively gives you a defined quantitative plot of how far your AFR is off from the target in each cell on your fuel map based on the averaged data from the log.
This is a plot setup such that the logged AFR and Target AFR are overlaid on the z axis (chart values) so that a POSITIVE number shows how RICH a cell was on average, and a NEGATIVE number reflects a LEAN condition from target. This is extremely useful during initial tuning when pull-by-pull readings may contain erratic data if the base fuel map isn't close to what the motor actually wants and in this case averages don't lie. To do this such that positive is a rich reading and negative is a lean, you set the Target AFR on the Z Axis and the Actual Logged AFR on the Delta Z Axis.
I use this method to shape the fuel table for cruise, spool and low boost to within about +/- 0.1 AFR of the target then move to inspecting the logs in a pull by pull fashion. What is great about this setup is that it allows you to quickly and accurately work the full range of a fuel map towards the target in one sitting with one log.
For example, the chart you saw about was derived from my last log on my semi peripheral single turbo 13b. As the fuel map is what I would consider to be extremely rough, I'm working it closer to running on target using MLV but will also show you here how it correlates to the Haltech log viewer in a pull-by-pull log check and ultimately the fuel map change.
While I will be working the whole fuel map against these rich/lean averages, it is very important to spot and correct any dangerous lean conditions. In this case the -0.60 lean reading at 11.6 PSI at 5000 rpms was sticking out like a sore thumb. I'll need to add some fuel in this cell in the map to clear up this lean condition. Given the cell above it at 11.6 PSI at 5500 was only -0.07 AFR from the target, this value is likely a good reference as to how far I need to move the 5000 rpm value.
So now, I'm gonna jump over to the Haltech datalog viewer to show how this software aligns with the MLV AFR/Target AFR map. When I have a lean patch in boost that sticks out that abruptly in an otherwise normal AFR spread, I will load the log into the Haltech log viewer and take a more in depth look at what is going on.
What you see above is one of about 10 pulls from the same log that the MLV table was derived from. I've zoomed in to just show the pull. On the top trace is Actual Logged AFR in orange and in light blue is the Target AFR. The middle trace shows both TPS and RPM and the bottom trace shows the Fuel-Load (Map in PSI/inHg in my case).
You see that mid-pull there is a spike in the AFR reading (orange line) where it goes LEAN from the target. Checking the peak of this lean spike against the RPM and MAP reading verifies this is at 5143 RPM and 11.3 PSI. So as we expected from the MLV AFR Plot, the 5000 RPM / 11.6 PSI cell in the fuel map is the outlier causing a lean spike during an otherwise on-target pull. Using the Haltech datalog software here verified that that this spike happened at constant, or at least linearly increasing TPS meaning the lean condition was directly a product of the values in the fuel map and not associated with a transient throttle event.
So now we jump over to the actual VE fuel map in the Haltech ESP software and locate the guilty cell where you have this:
In looking at the map I made these changes effectively increasing fuel for all 3 cells moving the 5000 rpm cell closer up to the value of the 5500 cell to correct the lean spike and move the fueling in all 3 cells towards maintaining the target AFR.
As you work through the fuel map for vacuum, cruise, spool and low boost you will come to find out what amounts of fuel change work for your setup and then be able to make a relatively accurate prediction of the fuel change needed based on how far the MLV AFR map has you off target.
When refining a rough or progressing fuel map based on the MLV AFR charts you don't necessarily have to go into extreme detail and check each lean condition using the log viewer to check out each pull, but it is important to know how to do so and how these readings in the AFR table were derived. You will have to use your own judgement as to when a spot check is needed, and how fan into boost you want to use this method of averages.
Personally I use it up to about 15-17 PSI on E85 and work the entire map to where the car runs within about +/- 0.1 AFR of the target. I spot check the outliers in boost conditions like the -0.60 lean condition at 11.6 PSI and then move to primarily working the map using pull-by-pull specific datalogs for all boost levels above ~17ish, while then using the MLV table as a quick check instead of primary tuning source.
You can tune a fuel map extremely well using this method through multiple iterations each one progressing towards at 0.0 AFR-Target difference and get there relatively quickly even when starting with a basemap. The key is to set appropriate AFR target levels for the fuel and boost levels you are running that contain some margin on the rich side. The map itself will take shape and form itself to match the fuel needs of the motor as you work the iterations towards the target.
When working the map, remember to always be more aggressive with adding fuel to correct a lean condition and less aggressive with removing fuel to correct a rich condition. The time it takes to make a few more iterations to safely work towards your target is miniscule compared to detonating your motor from a lean condition.
Please feel free to post below or hit me up with any questions you may have. I'm debating starting a youtube channel to cover this kind of tuning information in more rotary specific detail and get further into ecu functions, ecu differences, and rotary tuning methods and practices. The amount of tuning fake news on the internet today is unreal and it pisses me off to no end. I aim to bring REAL technical rotary tuning content to the table. Even if I do that, I'll follow up on here with the info as well. The forums are kickass and an information goldmine for those with patience and the ability to kick it old school and actually read.
Why go through all that when you can display AFR Difference in the Haltech log viewer?
It allows me to work the entire map instead of just the instant AFR offset at a set condition and the system of averages makes it easier, to me at least, to see how the actual map shapes out as a whole in relation to the target map.
I don't tune in a hurry and it has consistently been successful for me, whether its archaic or not. Going through this process where you look at the whole AFR spread like this will help somebody who is new to take their time and spot dangerous trends they might might would miss otherwise.
Also, I posted it in here in the general tuning forum as it isn't necessarily haltech specific and has worked well with a handful of different ecus.
Im curious how your calculating the % increase in the fuel VE map accommodate the MLV value its detected.
Is there an actual calculation you use?
For some reason my Haltch log export never bloody works. So use a different work around.
In playback function on the haltech (have your map and the date log loaded up. Find a location where the (Say 5000 rpm and 11.6 psi leann spot occurs) If you press play on the datalog. As the point tracks over the lean spot you can press 'Q' (quick tune). It only works in play mode. So then it will calculate the difference required.
Anyway that's how I do it.
-Anth
I don't specifically have a mathematical way I go about calculating the change. I typically just look at how far off target it is and then reference the cells around that one and how close or off-target they are and make an educating guess and error on the side of more fuel. I guess I should have mentioned all of this was done in open loop with no O2 control.
The values in the table shown in the post were just calculated to show how much they increased, not necessarily how much I opted to increase them.
I haven't used the quick tune feature and should probably play with it, but I can't see using it for boost cells. That being said I have no experience with it so I can't speak to how well it works.
Put it on a good dyno with load holding capability, use Quicktune. Finish the low load tuning in about an hour and be done with it. Your O2 transient time isn't being accounted for in your logging and throttle transients can also weight the results. Too many variables, IMO, to tune low load mapping through datalogging. Now, if you were to log and display a rolling average with proper consideration for O2 transient time and throttle transients, you'd have something. And that is what the LTFT function does.
Put it on a good dyno with load holding capability, use Quicktune. Finish the low load tuning in about an hour and be done with it. Your O2 transient time isn't being accounted for in your logging and throttle transients can also weight the results. Too many variables, IMO, to tune low load mapping through datalogging. Now, if you were to log and display a rolling average with proper consideration for O2 transient time and throttle transients, you'd have something. And that is what the LTFT function does.
I don't locally have access to a dyno where the owner will let me be in the driver seat and controlling the throttle, but that is another story.
You can set up a filter in MLV that would filter out all data captured during any transient throttle event where throttle enrichment went live. As for the O2 transient, I'm not sure how to capture that time delay. I know the Haltech O2 control has a table for this, but I'm not sure how you could measure it to be correct or not or tune it for a wideband placed further back in the exhaust, but I may just not be aware.
I personally don't like running O2 control until I've generally roughed out the fuel map to where it relatively follows the target AFR. For the LTFT to work right and provide meaningful data the STFT has to be configured properly which requires tuning PID values to be correct specifically for that fuel system/wideband interface and responsiveness. I can't see how you could accurately tune the PID values until you have a functional semi-consistent range of feed forward data. I still operate under the old principle of tune everything for the baseline condition in open loop, then use closed loop for tight control to account for the deviations that arise from various road/climate/temp/load conditions.
Please correct me if I'm wrong, or possible behind on the times. This is my first experience with the elite/esp. I did follow this on my last stock port 6266 setup with an old pnp adaptronic unit and the final product drove damn near like an OEM car.
On my PS 1000 , I log AFR Difference and tune in ms. As I review the log, I note a high or low cell and apply this formula to arrive at the K (correction) factor.
Actual AFR reading/Target AFR = K x cell value = new cell value.
In your case; 14.8/11.5 = 1.286 x 131.7 = 169.5. This is significantly lower than your "educated guess" of 136.5 so I don't know if this applies to VE tuning or your too conservative on your educated guess.
This formula gets me closer faster the the desired AFR.
I would think that the Elite would use correction based on a formula like this. Perhaps that is what Quicktune does.
Following your calculation I would end up with this
Which does not represent the fueling needs of the motor...you can't blindly rely on a calculation. You need to instead look at the afr in cells prior to and after the one and make an approximate thought out decision. The system of AVERAGES is just that, which in and of itself filters out all of the random transient hit points and gives you an average number for that cell.
Its for roughing out a map, not nailing one dead nuts to the wall.
With time, as you work through it you will notice the AFR lag between the main fuel table fuel cell value and MLV average that is due to the O2 transient that isn't accounted for in this and you use your brain and tune around it or use the other software.
When you at first working out the fuel map you don't need to be stabbing the throttle and instead need to make a point to be as steady on the throttle as possible. Transient throttle tuning isn't the first thing you hit on the dyno, should you have the luxury of one.
Yes, I use a little bit of "gut" when adjusting the cell to determine what the adjacent cells get corrected to.
If you choose a point on your data graph that is off from target AFR, that point is shown in the cell via the cell pointer. It is rarely centered in the cell. Often skewed top, bottom, left or right. I use that bias to get a "gut" feel for adjacent cell corrections.
I think we have a similar approach. I found the math tells me the % of correction that I'm working with.
Put it on a good dyno with load holding capability, use Quicktune. Finish the low load tuning in about an hour and be done with it. Your O2 transient time isn't being accounted for in your logging and throttle transients can also weight the results. Too many variables, IMO, to tune low load mapping through datalogging. Now, if you were to log and display a rolling average with proper consideration for O2 transient time and throttle transients, you'd have something. And that is what the LTFT function does.
Seth, this is what I was referring to over our little chat not too long ago. Running my Honda ECU entirely open loop and watching the Wideband O2 gauge's trends of delay really get you an idea of WHEN you're having lean/rich conditions and why.
Things to consider are location of sensor, RPM (mainly) and load (secondarily) do alter the response time you'll see at the sensor. It's minute, but you'll see the value of interpreting this by hand vs. trusting computers to calculate when values are skewed.
One big thing that's VERY simple to spot is decel cut to tip-in refueling in which as you initially let off the throttle, your AFRs spike rich until your decel cut occurs, then holds maximum lean until you re-apply throttle. Dialing in the reapplication of throttle is very easy, and should be stoich.
One thing that I find funny is we're talking about these processes of tuning, but never really more in depth to why our timing and fueling curves are the way they are. I would hope that none of you just slap in a basemap from whatever ECU and expect the car to perform great. I also hope that no one is thinking that immediately off of some certain load, that maximum power AFRs should be targeted. My point here is that there is a lot of blending to not be wasteful (and to actually make REAL WORLD driveability/power).
At the end of the day, for rotary engines, we know that fueling is our source of cooling. We run fat to keep temperatures in check.
I�m bringing this to the top as I am going to attempt this method and Skeese has been generous with his time and helping me make the transition from being a long time Power FC user. I know all of you put in personal time helping others on here and as a newbie to Haltech the posts and shared knowledge is appreciated.
I picked up a Haltech Elite 2500 plug and play now that it�s available for the Series 6. I know it doesn�t have as much functionality as a complete rewire with all the sensors but it�s a softer dive for me into the Haltech.
I may have Chris Ludwig build me a complete terminated harness in the future to add more functionality.
Right now now I have my Ballenger NTK Wideband hooked up analog. Skeese helped me out making adjustments for my injector flow and lag times and the car fired right up.
New ported motor from JPR Imports with RX Parts seals. New EFR 8374 EWG. 93 octane tune with water meth for now.
Just looking for a solid street car with some safety features to protect the motor. I have bad luck with turbo rotaries when it comes to blowing motors. The move to the Haltech is in response to that.
I will post up my experience with this method as a true novice to tuning. I hope to get started by the weekend weather permitting.
So much for more info. Snowflake moderators didn't like one of their vendors getting fact-checked.
Yeah, somewhere around 2005 it appears people quit putting this level of work and detail into the forum posts. I've got probably 10 pre-written informative threads I never posted after being irritated I got flamed on here after all of this effort. I'm going to revisit those papers and probably just mass post it all for the benefit of those actually willing to put in the effort to learn. Those that want to hate or comment negatively can, but the methods and results will speak for themselves and the end users are free to make up their own mind. At the end of the day I don't see anyone else these days putting this level of effort into the forums to help others, so it isn't going to hurt my feelings either way.
Originally Posted by Narfle
Don't be a jerk to vendors.
While I understand that people who pay to have their own sublet on the forums can moderate the content and message on their page the open forums should remain a place where everyone is equal. If a select handful of salesmen pay to have influence, censorship and control via moderators (essentially forum government) over who is/isn't allowed to post and what isn't allowed to be posted...I personally find that to be a short drive to forum communism. Regardless, it is very closed minded. Now if you will, can we leave this technical how-to-thread that was meant to help out those seeking to learn be just that? If you have anything negative further, I recently cleaned out my inbox and have plenty of room.
Otherwise...lets see how close someone following this has gotten to zeroing out an AFR/Target AFR histogram. I'm going to dig up my old maps and post some of my results as soon as I can find my missing-in-action external drive.
And I've recently been out of the game due to having had a first kid and having some other medical stuff come up. I do need to dig back through my hard drive and show some of the results I've managed from this in the past. Its a great system, and it works. I had a 13b-REW swapped RX8 remote tuned that ran within +/- 0.1 AFR from target across the entire boost region of the map, the owner of which said drove like an OEM tuned car.
Thanks to you, Seth, I picked up MLV for $40 and made a damn good use of it so far. Really does help a lot and is a badass tool. Thank you for continuing to build on your guides.
Thanks to you, Seth, I picked up MLV for $40 and made a damn good use of it so far. Really does help a lot and is a badass tool. Thank you for continuing to build on your guides.
What's really useful is all of the other things you'll find you can do with it, the end user's intuition is the only limitation. Try mapping out your EGT1 vs EGT2 difference across the same load vs rpm map, and then reference that against front/rear injector bias based on map and RPM to balance the EGT across the whole map spread as the the split moves towards zero. It really is a cool tool.
Scatter plots are gold.
Something I have noticed is that my histogram will often show my afr,s looking dialed in when there are in cfat areas that need work still. Checking the live log and scatter plots is still required. Andy whittle is a good source of info if you weren't aware of him on YouTube.
Been a good while since I posted on this thread, but I'm still using MLV nearly the same. Here is an example of a car I remote tuned recently after a guy on here contacted me through PM. His previous t00ner managed to write a file so bad it killed the engine and required it to be rebuilt (things like the haltech DBW TB motor driver outputs being wired to the fans!? WTF?!). After a good number of iterations across about 2-3 weeks he's now fully sorted on a tune that 1) starts up perfect every time 2) warms up smoothly every time 3) runs and drives smooth clean and happy in vacuum, every time and 4) pulls hard though boost up to the 14 PSI spring pressure running safe AFRs and timing.
These days when I'm using the MLV histogram to help sort out a fuel map using haltech logs, I just flip the units over to reflect kPa in ESP for my fuel map updates. I still think in terms of PSI, however for the purpose of using the kPa data from the log in MLV and implementing it in the main fuel map it really doesn't matter and this is easier than converting for the sake of converting.
I've also started to do more of the initial rough tuning in lambda, mostly for the sake of efficiency. I've found that something near ~.20 AFR correlated to ~0.1 lambda when setting up the AFR/Lambda vs. target offset table and when you're first roughing out the map there isn't any need for super fine detail as it won't help you until the car is running close enough target to actually use that data.
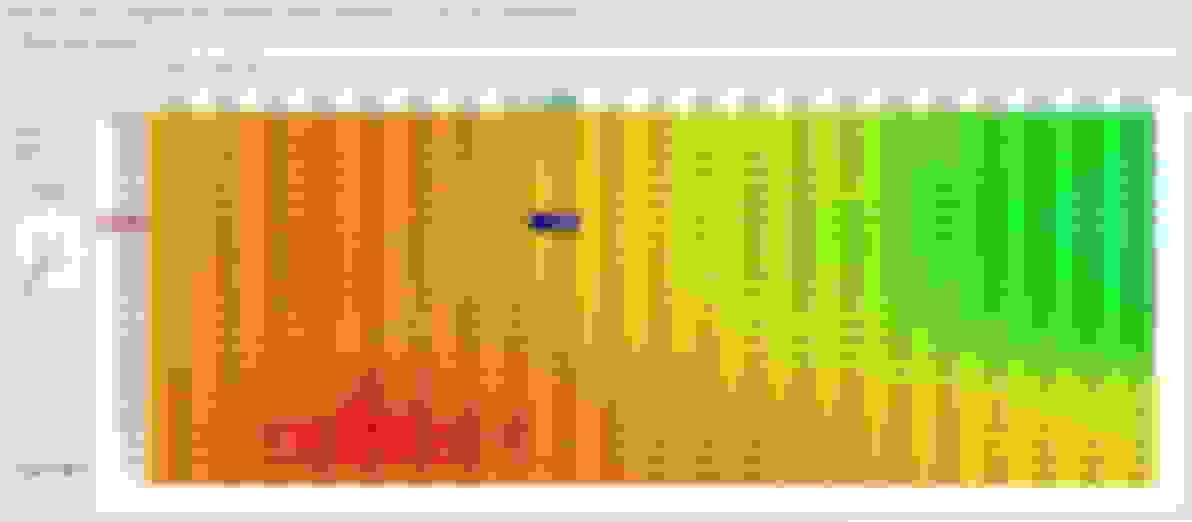
Here is the target lambda Vs. wideband measured lambda table from one of the recent logs where a positive value represents a rich condition from the target and negative represents a lean condition. All of the lean looking stuff in the patchy white low-hit-count cells in positive pressure starting at ~4000 rpms isn't really lean, but rather just where the decel condition goes active when the shift happens. Looking at the yellow/green region where the car is actually spooling and pushing boost under load it pretty much runs dead nuts on target, hard to get much closer than that. Not to mention, everything in boost on this file runs in OPEN LOOP.
Now here is the same log and graph with the units flipped over to AFR instead of lambda and you'll notice there is a bit more fidelity here. Sure I could add decimal places to the lambda reading and do the same thing, but to me it is easier to just flip between the two settings as needed. Since this log, I've made a couple more iterations to the file and now the entire positive pressure spool/boost region runs within 0.1 AFR of target, and only on the rich side of the target.
When utilizing closed loop fueling, I also use the MLV histogram function to get an idea how much the fuel trim is adding/subtracting in each cell to account for the sensed lean/rich condition. Due to the rationale listed in the posts above regarding target overshoot, its important to at least spot check lean/rich regions for what the trim is doing compared to whether you were lean/rich when you're using the AFR/Lambda vs target feature to sort fuel.
On my car, I've transitioned to AlphaN TPS-Load based tuning where the main fuel table is TPSxRPM and then there is an additional MAP compensation table that applies additional fuel to the main table once you cross into positive pressure. The tuning is a good bit different, but also the same in a number of ways and I've put together a general method that has allowed me to successfully, consistently and predictably iterate the TPS Load tune file towards running on target. Not sure if I'll post that up on here, make a separate thread, or keep that to myself.
Please feel free to message me if you have any questions.
Nice thread! I've been using MLV in roughly the same way. One thing I saw mentioned was transients and how do you filter them. Averaging is one way to go about it, I use a different method which I like (not saying there's a right way to do things, just more options for those who want them).
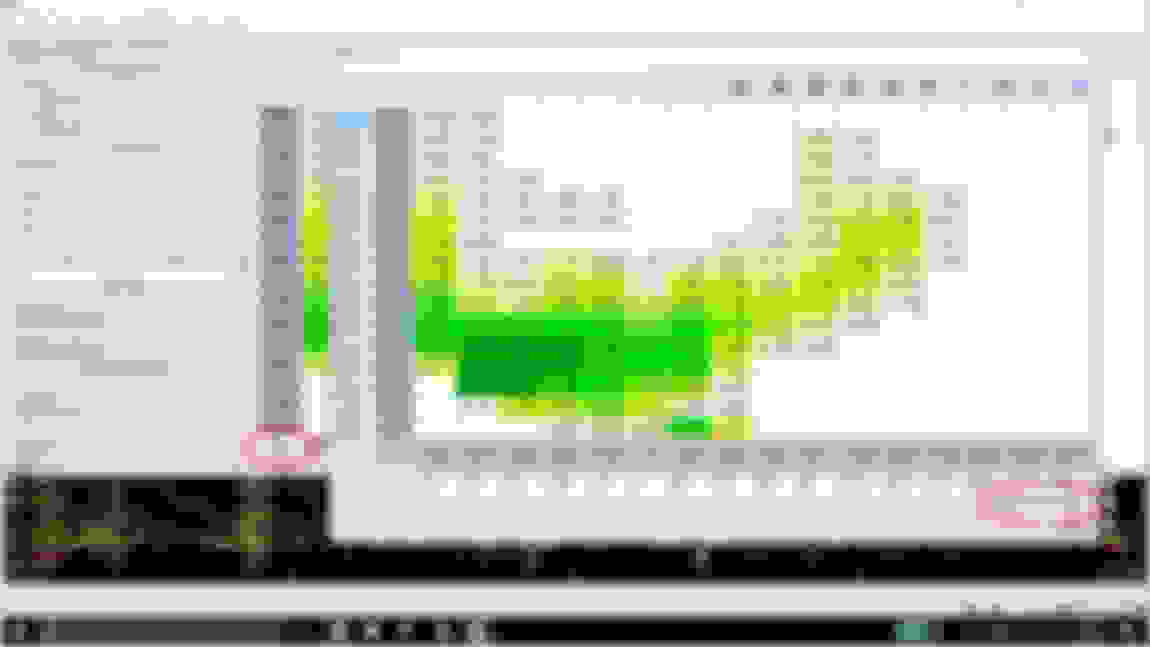
First, I add a calculated field to determine the (rough) derivative of the data I want to filter. This is as dead simple as taking the raw difference between one logged point and the previous logged point, which MLV can do. For example if I wanted a TPS deriv. function I would just do [TPS]-[TPS-1]. Doing so gives you something like the photo below.
TPS is white, our TPS derivative calculation is yellow. Now we get a large spike when our TPS moves a lot, a little spike when it moves a little, and zero when our TPS is still.
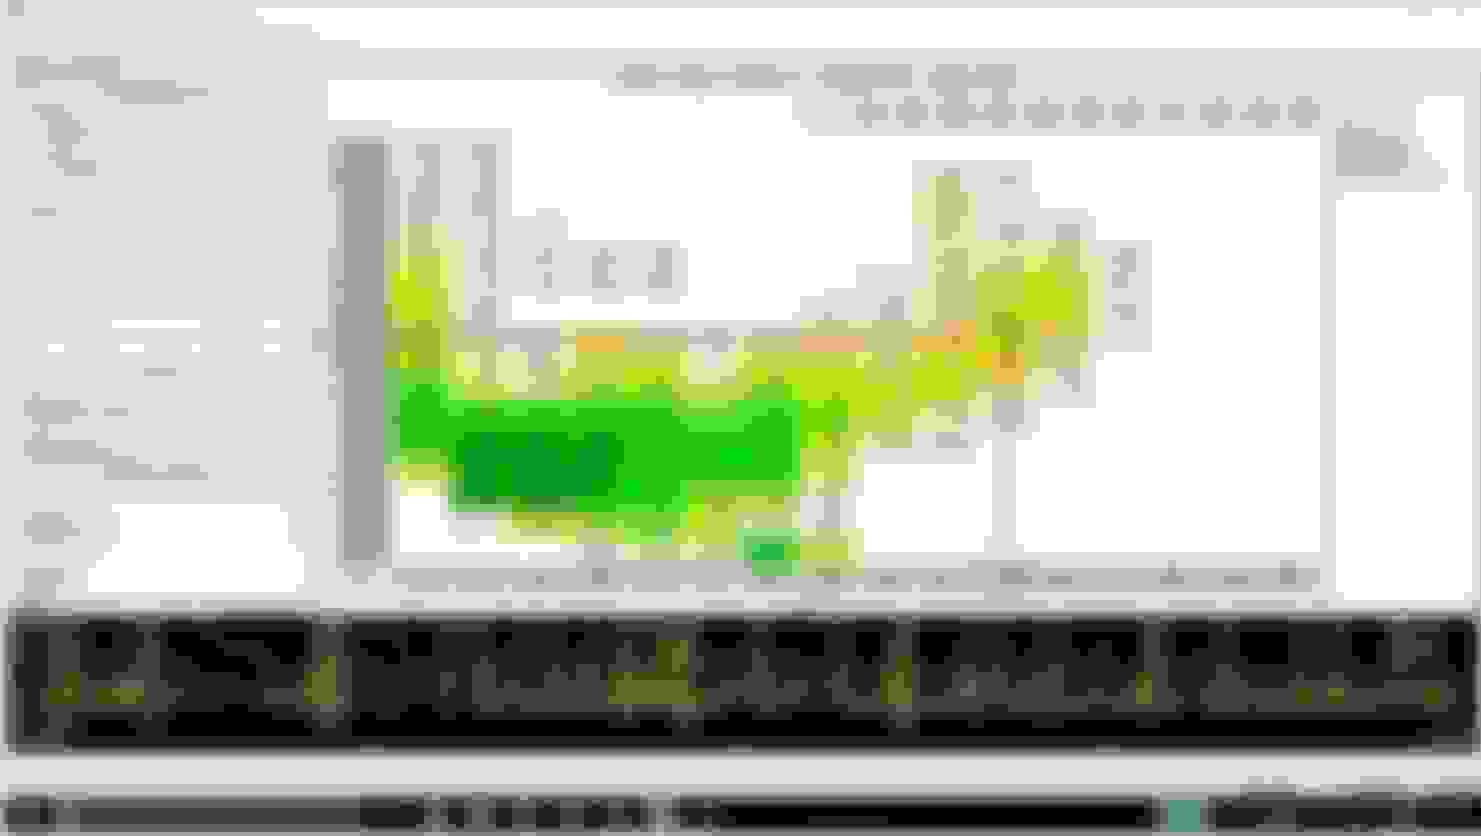
Next, we can use this to generate "flags" that we can use to tell MLV what data we want filtered out when it makes our histogram. We can make another custom field for "TPS Transient". This one would look at our TPS derivative, and make a determination of if the change in throttle position is big enough to cut out of our histogram data. For example, I used this formula (abs([TPS Derivitave]) > 2 || [TPS] < 0.2 ? 1 : 0). Its basically saying, if the absolute value of the TPS derivative (yes, I spelled it wrong in my actual formulas, I'm too lazy to change it) is greater than 2, OR the TPS value itself is less than 0.2, set this field to a 1, otherwise set it to zero. What that looks like in practice is below.
Kind of tougher to see, but basically it is exactly as we described: a field which is set to 1 only if the pedal is moving too quickly or not pressed enough.
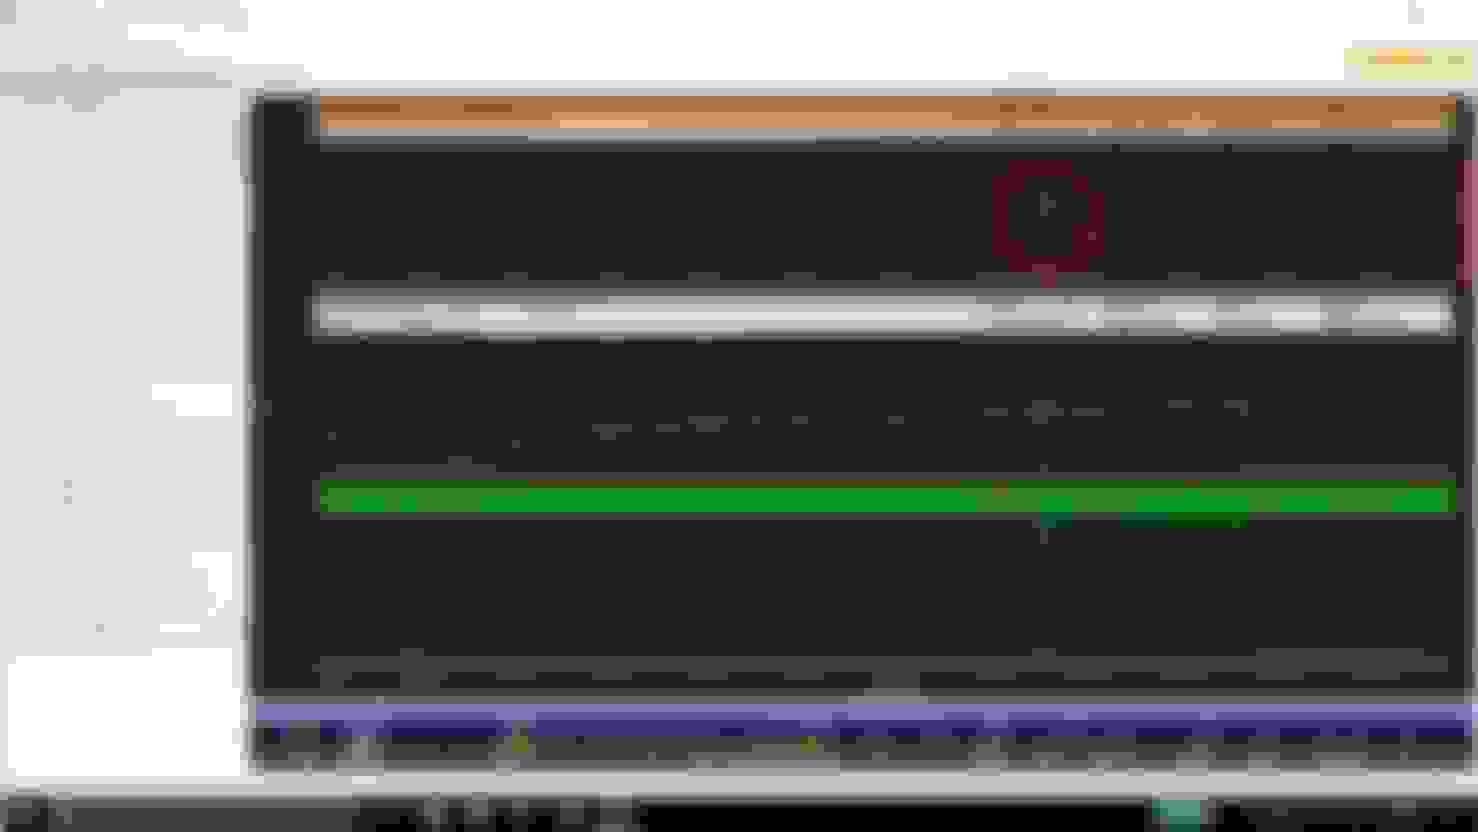
Alright, lastly we can put everything into action by adding the flag we just created to the histogram filter. On the right side of the histogram tab, we can add our own data filter. We can add one for our transients and use the formula [TPS Transient] > 0 to have it ignore all data in our log where the transient flag we just set up is set to 1. So that's it! You can do exactly the same trick with AFR, or whatever else you want to filter and only get steady-state data from. This is super useful for bigger logs where you want to chop out things like decel, enrichment, idle, whatever, and just focus on getting a clean fuel map.
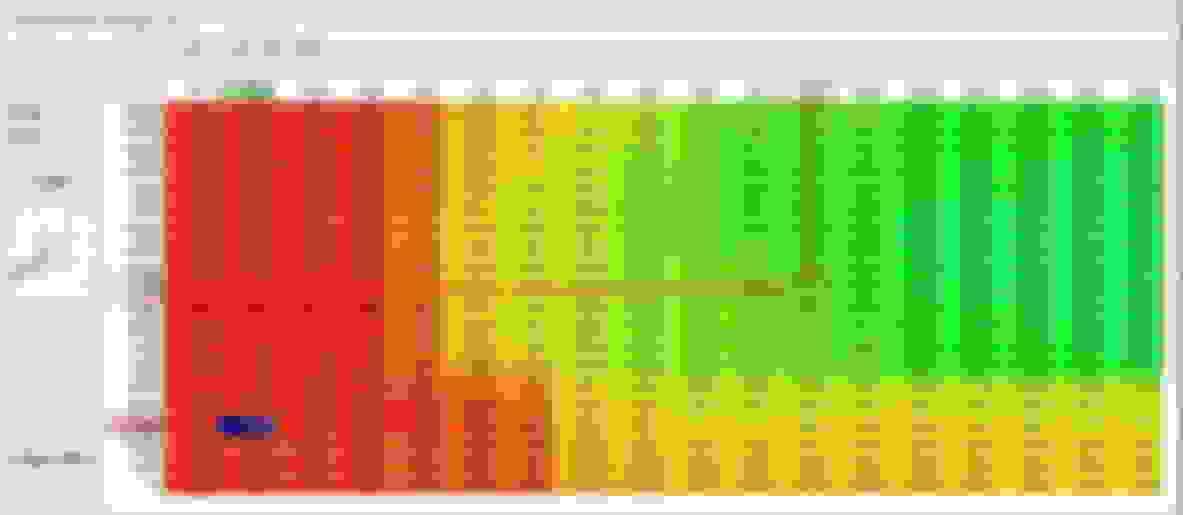
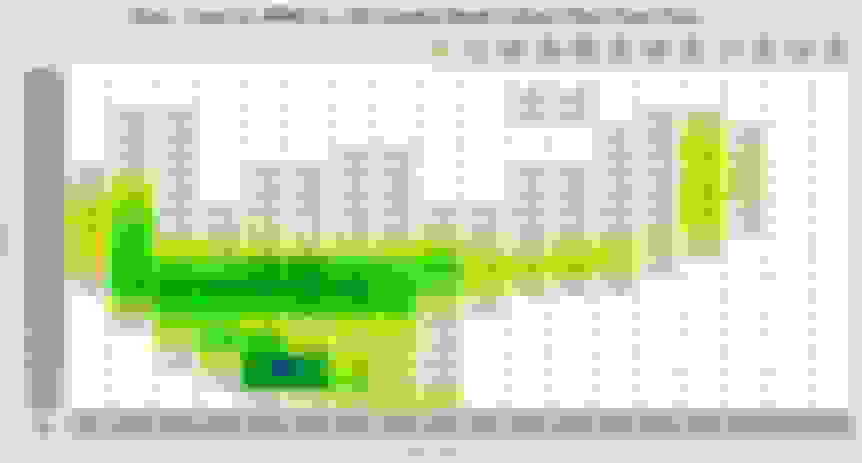
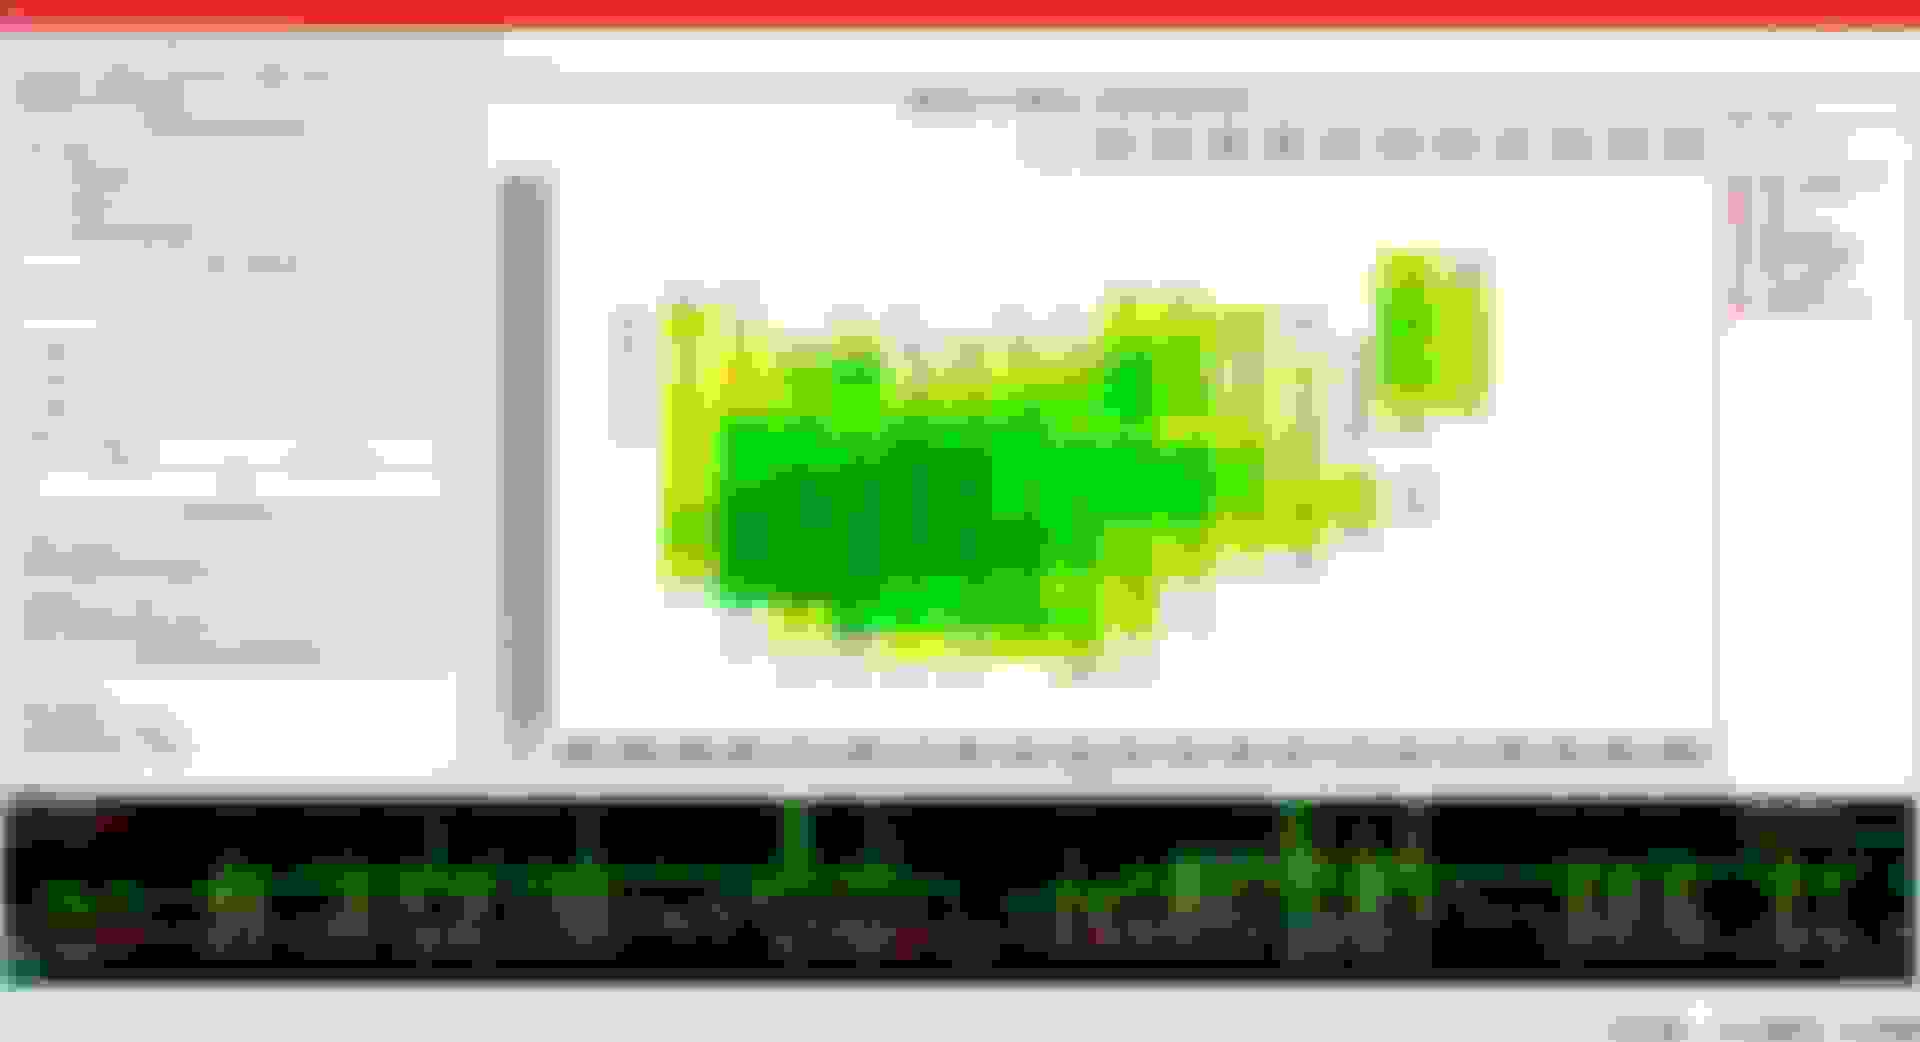
So you can be more confident in your histogram numbers, going from something like this:
To this:
And playing around with how aggressive you want to be could yield even better results. And something to observe is, sure it cuts out some of the outer clutter but the big win is that even some of the cells that have a high hit-rate are changed as well due to filtering out transient data. This of course doesn't give the ability to not use your head when adjusting your map, but it paints a much more accurate picture of what you really need to adjust to. Plus I love that you can look through your log and visually see what data you're omitting from the histogram just by observing your flags. Hope this proves useful!
 08-14-17, 08:16 PM