
Megasquirt Stock S4 Spark Maps (what does everyone think of them)

Stock S4 Spark Maps (what does everyone think of them)
I came across what are apparently some stock spark maps for an S4 turbo (n332) and na (n326) that someone over at nopistons pulled from the ecus, and tried to match them up with what we had to play with tuning-wise. I also wanted to see how my map and a lot of the other spark maps up here compared.
There was no load called out, but Im guessing the NA map went from an equivalent 10-20 kPa (the top numbers, series 1 in the graph) to about 100-105 kPa (bottom numbers, series 29). There are large regions of replicated numbers though, so I am less certain on this than the turbo map. The turbo map seems to go from 10-20 kPa (series 1) to 140-160 kPa (series 19). Comparing the NA and turbo maps (and looking at where the turbo map just seems to be roughed in cause the engine couldnt build boost there), series 12 seems to be atmospheric pressure, which makes the unknown scale pretty linear with pressure (i've roughed one in on the turbo leading map). I tried to replicate these pretty closely in the msq file in the zip file.
Turbo Leading:
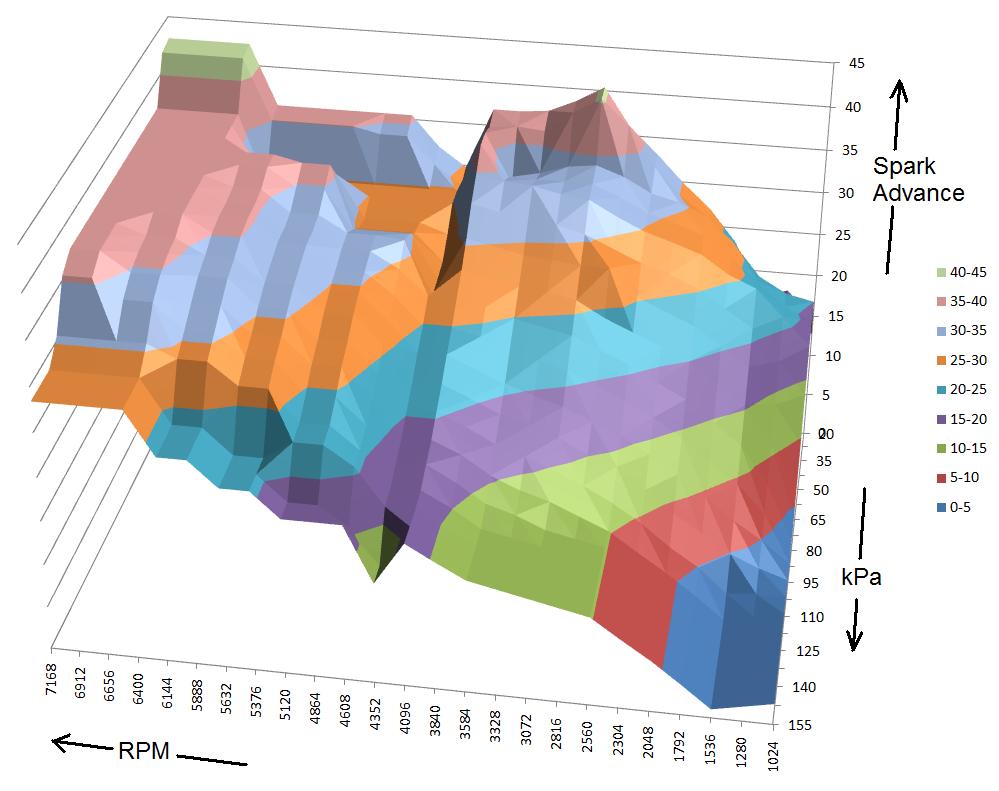
I guess it looks much like you'd expect, besides a line of much less advance at 4300 rpm and a low patch from 35-65 kPa and 4300-5600 RPM which both seemed odd, since I hadn't even seen anything like this on BDC's or others maps.
Turbo Split:
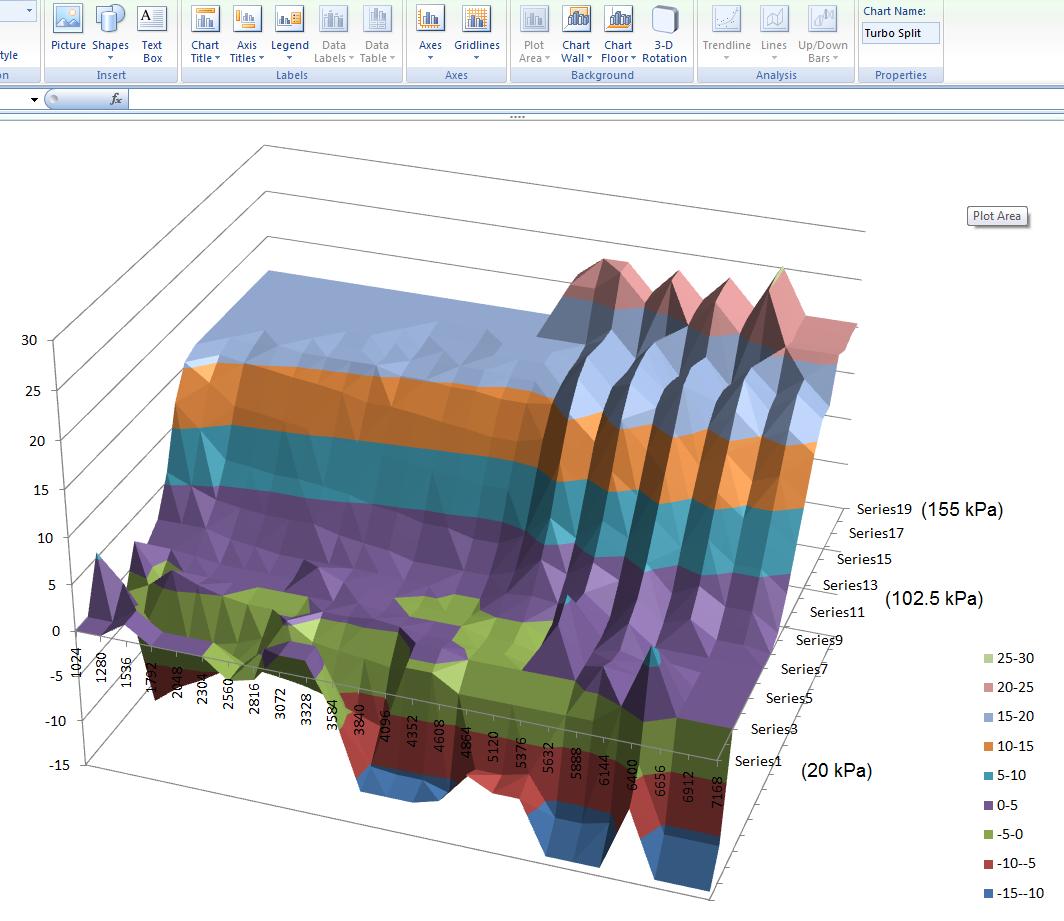
Zero, and even a bit of negative split at lowish loads (below atmospheric). Maybe to act as extra advance since the trailing plug would be more central to the combustion chamber at those loads than the leading plug would be? Conversely, high loads and high rpms there are spikes up to 25* of split. Both the low and the high here are out of the available range for MS
NA Leading:
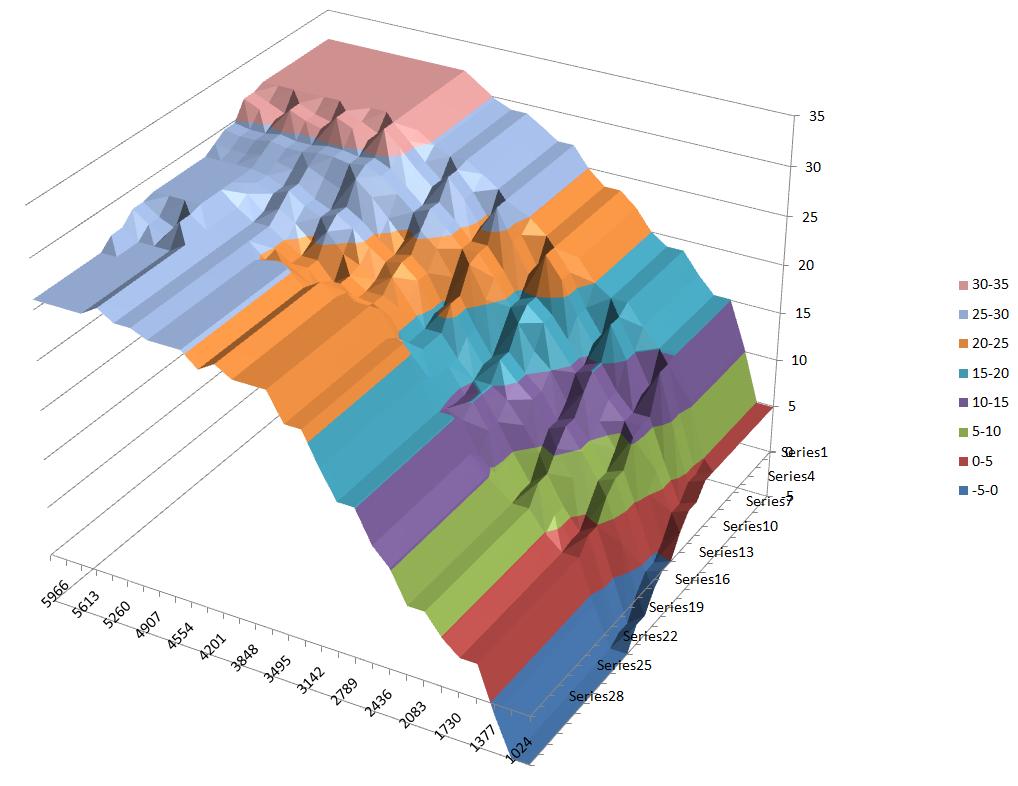
This is a bit more along the lines of what you'd expect to see, except there are large areas of replicated numbers, which makes me wonder about whether this is how the map actually appears, or whether some values got replicated (there are 30 rows of load data for the NA map (9 replicated) and only 19 for the turbo)
NA Split:
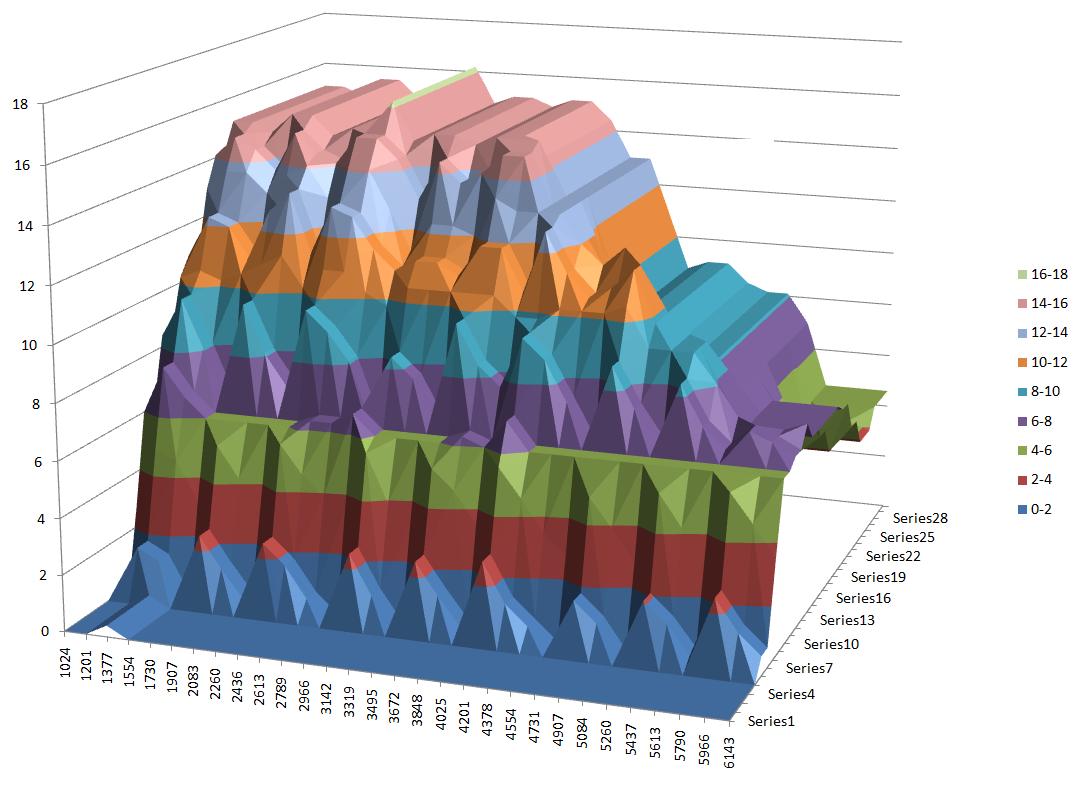
Again, all the replicated rows of load data, and 0 split at low loads. This one does seem a little odd too since there is definitely a periodic trend based off of RPM. Also the split decreases in the approximate area where the 5th and 6th ports would be open (although I am not sure if this is the reason for the difference).
For those more familiar with tuning rotaries, do these look like reasonable maps? I'd like to try the turbo spark map in my car and work away from that, but since its my only car/DD, I'd like to make sure that it seems reasonable to those who have much more experience than I do with this.
There was no load called out, but Im guessing the NA map went from an equivalent 10-20 kPa (the top numbers, series 1 in the graph) to about 100-105 kPa (bottom numbers, series 29). There are large regions of replicated numbers though, so I am less certain on this than the turbo map. The turbo map seems to go from 10-20 kPa (series 1) to 140-160 kPa (series 19). Comparing the NA and turbo maps (and looking at where the turbo map just seems to be roughed in cause the engine couldnt build boost there), series 12 seems to be atmospheric pressure, which makes the unknown scale pretty linear with pressure (i've roughed one in on the turbo leading map). I tried to replicate these pretty closely in the msq file in the zip file.
Turbo Leading:
I guess it looks much like you'd expect, besides a line of much less advance at 4300 rpm and a low patch from 35-65 kPa and 4300-5600 RPM which both seemed odd, since I hadn't even seen anything like this on BDC's or others maps.
Turbo Split:
Zero, and even a bit of negative split at lowish loads (below atmospheric). Maybe to act as extra advance since the trailing plug would be more central to the combustion chamber at those loads than the leading plug would be? Conversely, high loads and high rpms there are spikes up to 25* of split. Both the low and the high here are out of the available range for MS
NA Leading:
This is a bit more along the lines of what you'd expect to see, except there are large areas of replicated numbers, which makes me wonder about whether this is how the map actually appears, or whether some values got replicated (there are 30 rows of load data for the NA map (9 replicated) and only 19 for the turbo)
NA Split:
Again, all the replicated rows of load data, and 0 split at low loads. This one does seem a little odd too since there is definitely a periodic trend based off of RPM. Also the split decreases in the approximate area where the 5th and 6th ports would be open (although I am not sure if this is the reason for the difference).
For those more familiar with tuning rotaries, do these look like reasonable maps? I'd like to try the turbo spark map in my car and work away from that, but since its my only car/DD, I'd like to make sure that it seems reasonable to those who have much more experience than I do with this.
MegaSquirt Mod
Joined: Sep 2004
Posts: 4,721
Likes: 1
From: Maryland
IF you could use megatune and put these into the spark table or split table, and display those it might be easier to get a good idea of exactly what values are at which points in the table.
Ken
Ken
I did try to put them in the msq file thats in the zip file, but I was a bit uncertain about the load values since they werent called out in the original files. I've taken guesses at the upper and lower values and where atmospheric would be on the turbo map, and it comes out pretty linear based on some combination of guesses.

Thread
Thread Starter
Forum
Replies
Last Post
trickster
2nd Generation Specific (1986-1992)
25
Jul 1, 2023 04:40 PM
befarrer
Microtech
3
Aug 22, 2015 05:52 PM